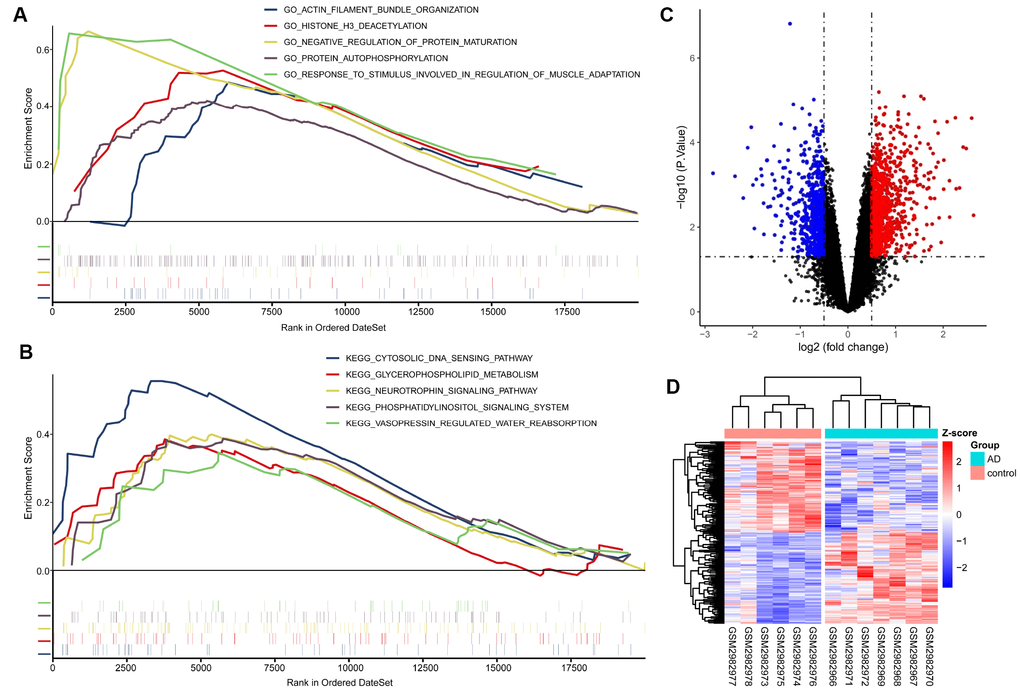
Figure 2.GSEA, difference analysis and cluster analysis. (A) Five of the most significantly enriched BP gene ontology (GO) terms. (B) Five KEGG pathways with the most significant enrichment. The mini vertical line indicates genes. (C) Volcanic maps of differentially expressed genes. Red indicates genes upregulated in AD; blue, genes downregulated in AD. (D) Cluster analysis heatmap showing how these expression patterns of these DEGs can distinguish AD from normal control tissues.