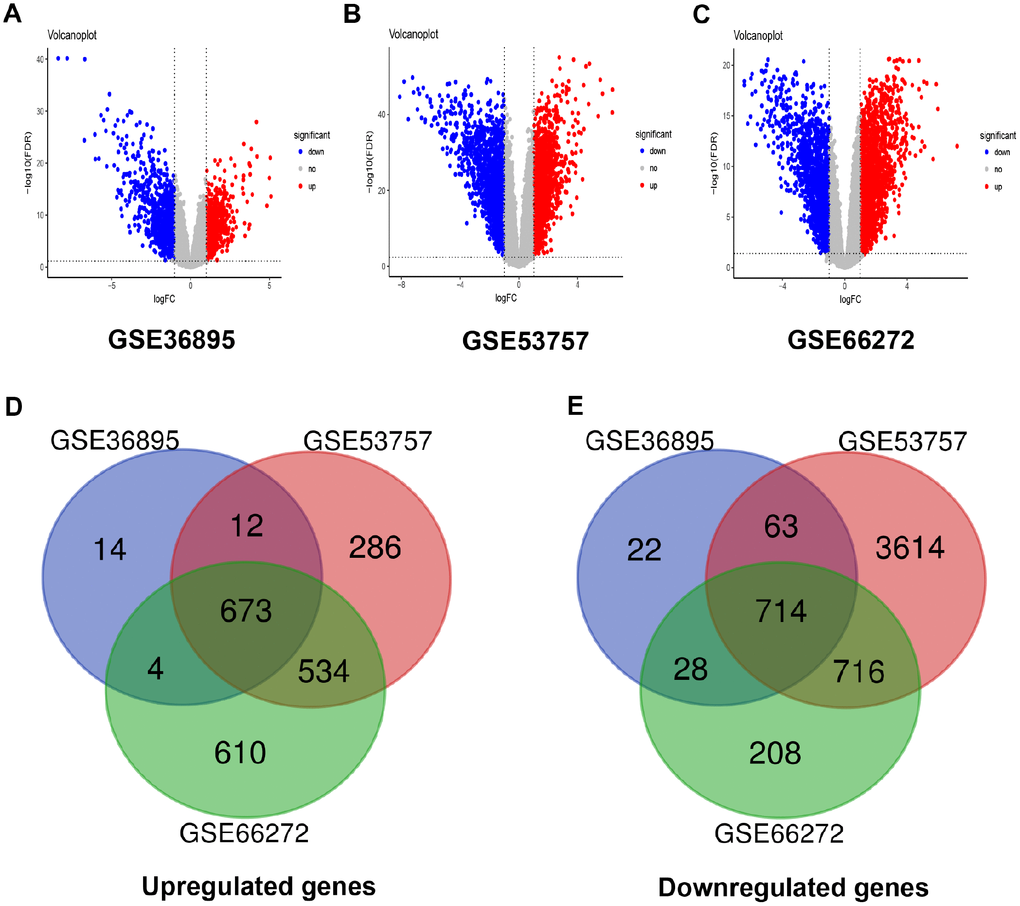
Figure 1.Differentially expressed genes and common differentially expressed genes in three datasets. (A–C) The volcano plots visualize the differentially expressed genes in GSE36895, GSE53757 and GSE66272, respectively. The red nodes represent upregulated genes. The green nodes represent downregulated genes. (D–E) Common differentially expressed genes in three datasets.