Submit an Article
Navigate
Home
Editorial Board
Editorial Policies
Current Volume
Archive
Scientific Integrity
Publication Ethics Statements
Interviews with Outstanding Authors
Newsroom
Sponsored Conferences
Podcast
Contact
Special Collections
Submit an Article
Online ISSN: 1945-4589
Research Paper
|
Volume 11, Issue 15
|
pp. 5579–5592
Integrative analysis of DNA methylation and gene expression to identify key epigenetic genes in glioblastoma
Back to article
Figure 7
(7 of 9)
−
100%
+
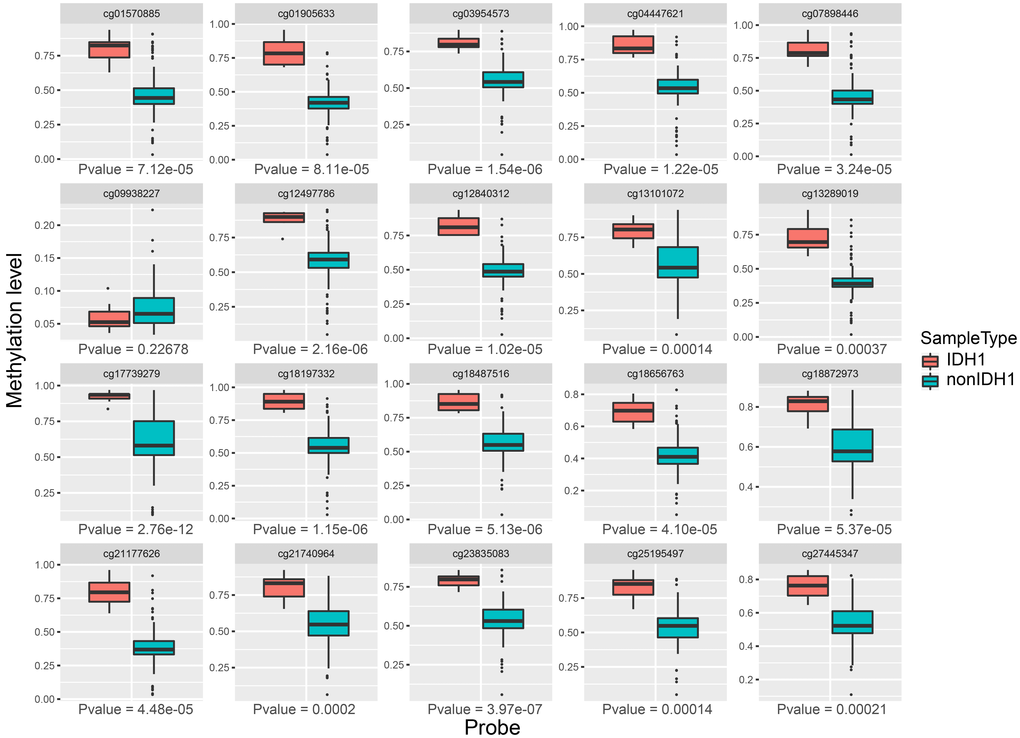
Figure 7.
The expression profiles of 20 methylation sites between IDH1 mutation and non-mutation groups.
Figure 7 — Integrative analysis of DNA methylation and gene expression to identify key epigenetic genes in glioblastoma | Aging