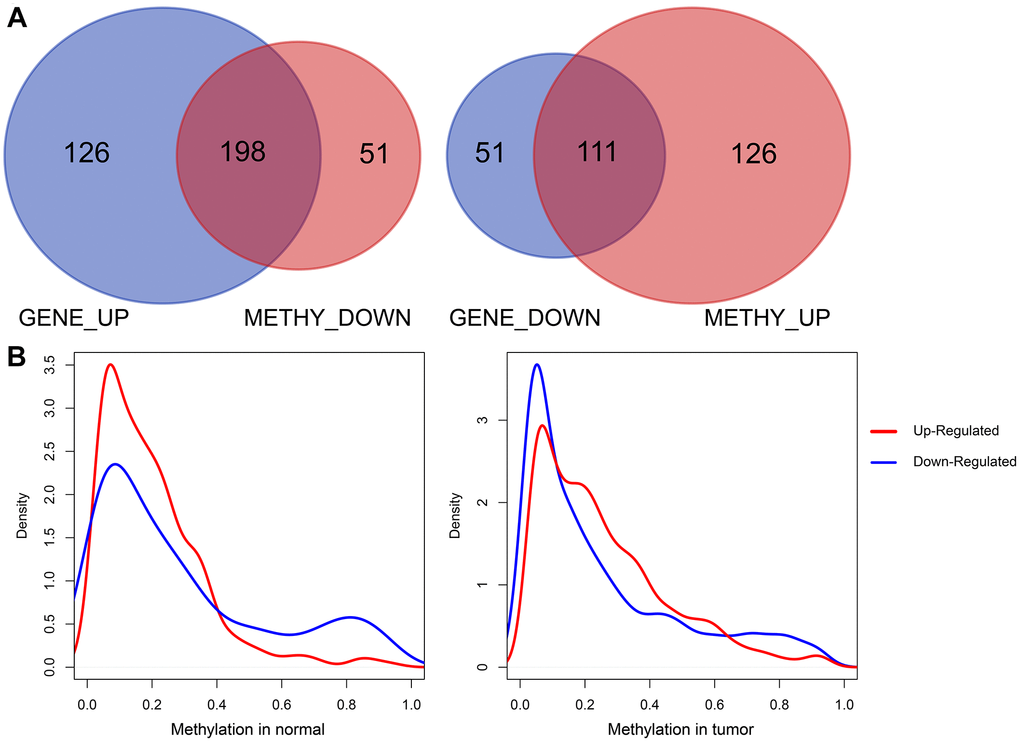
Figure 3.Correlation analysis of DEGs and survival-methylated genes. (A) The intersection results of DEGs and survival-methylated genes. (B) Distribution of promoter methylation levels in tumor and normal samples.
Figure 3 — Integrative analysis of DNA methylation and gene expression to identify key epigenetic genes in glioblastoma | Aging