Submit an Article
Navigate
Home
Editorial Board
Editorial Policies
Current Volume
Archive
Scientific Integrity
Publication Ethics Statements
Interviews with Outstanding Authors
Newsroom
Sponsored Conferences
Podcast
Contact
Special Collections
Submit an Article
Online ISSN: 1945-4589
Research Paper
|
Volume 11, Issue 15
|
pp. 5570–5578
Effects of inflammatory responses, apoptosis, and STAT3/NF-κB- and Nrf2-mediated oxidative stress on benign prostatic hyperplasia induced by a high-fat diet
Back to article
Figure 1
(1 of 3)
−
100%
+
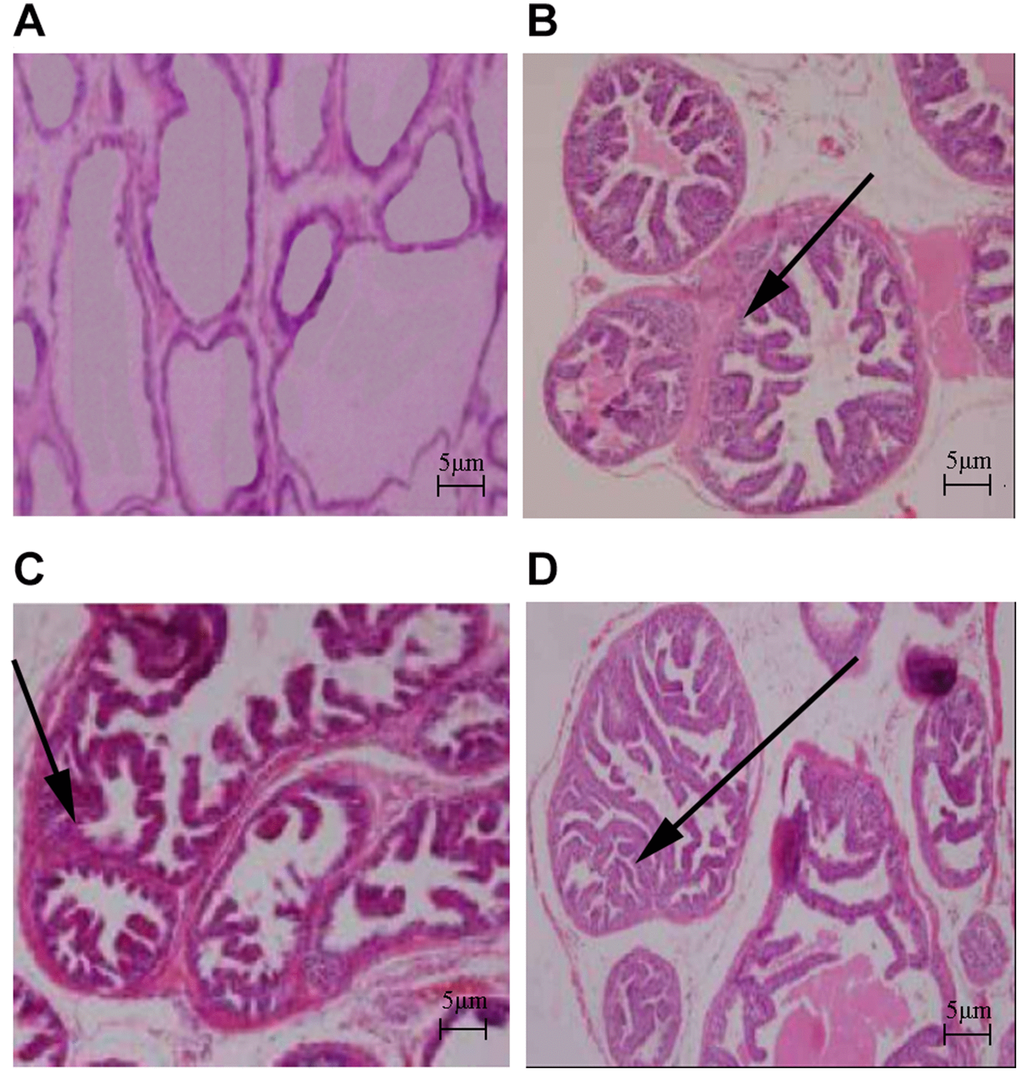
Figure 1.
Histologic changes in rat prostate (HE stain, ×40).
(
A
) Control group; (
B
) HFD group; (
C
) Testosterone group; (
D
) HFD+testosterone group.