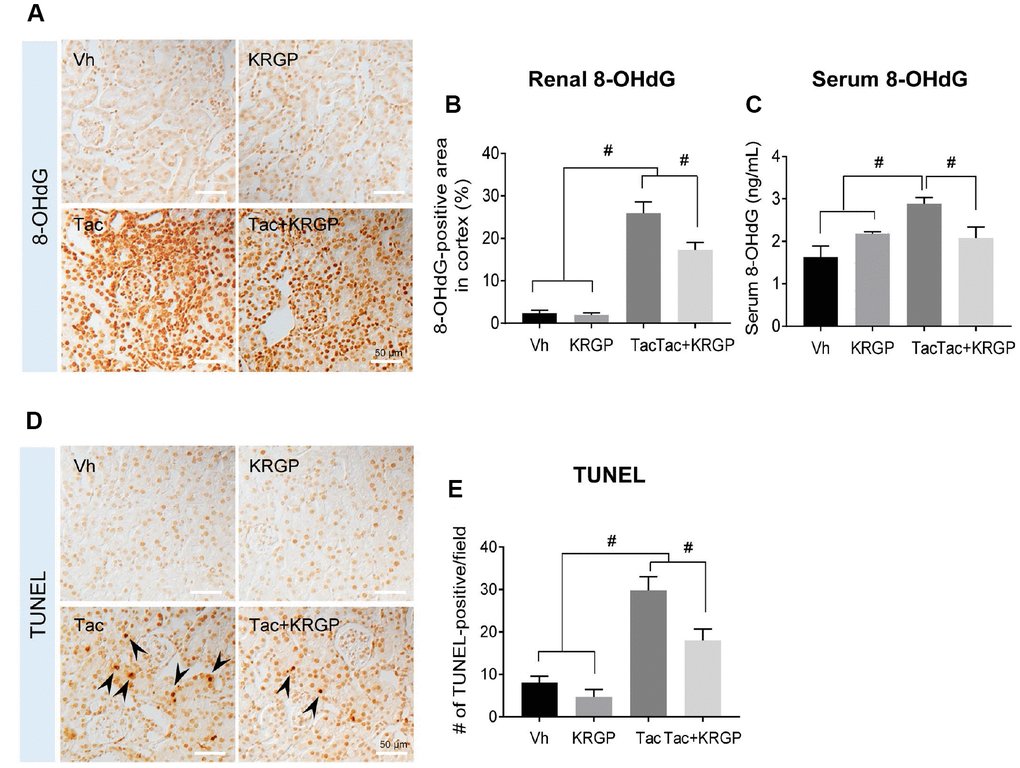
Figure 2.Effect of KRGP administration on Tac-induced the expression of 8-OHdG and TUNEL in a mouse model. (A and B) Representative images and immunohistochemical assay results for 8-OHdG in tissue sections from mouse kidney. (C) 8-OHdG level in mouse serum. (D–E) Representative images and quantification of TUNEL assay in tissue sections from mouse kidney. Bar = 50 μm. Data are presented as mean ± SE. n = 8. #P < 0.05.