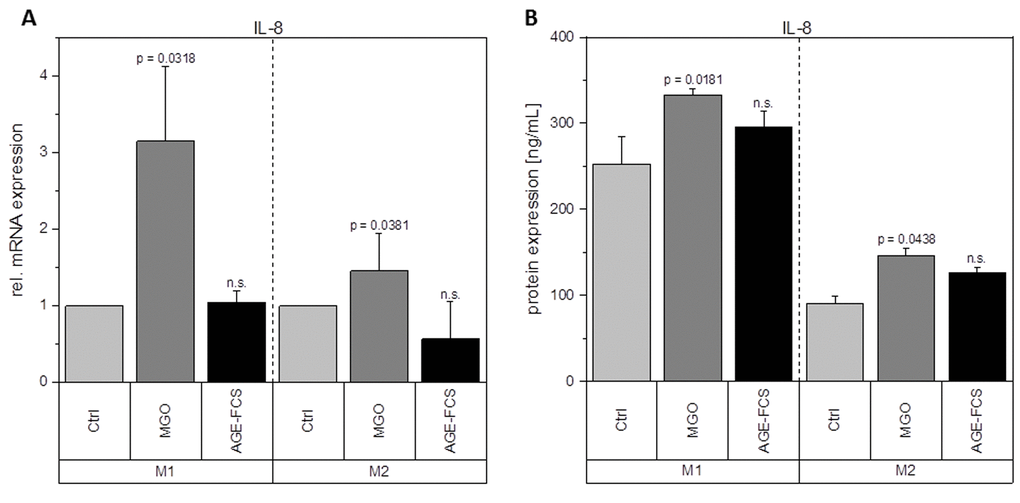
Figure 8.Expression of IL-8 after glycation. THP-1 macrophages were glycated with 1 mM MGO or treated with 10% AGE-FCS and polarized in M1 or M2 phenotype. Expression of IL-8 was quantified using qPCR (A). Data was normalized to untreated control cells. Graph shows average mean of relative mRNA expression + SD of 3 independent experiments. Protein secretion of IL-8 was quantified in the cell supernatant using cytometric bead array (B). Graph shows average mean of IL-8 concentration (in ng/mL) + SD of 3 independent experiments.