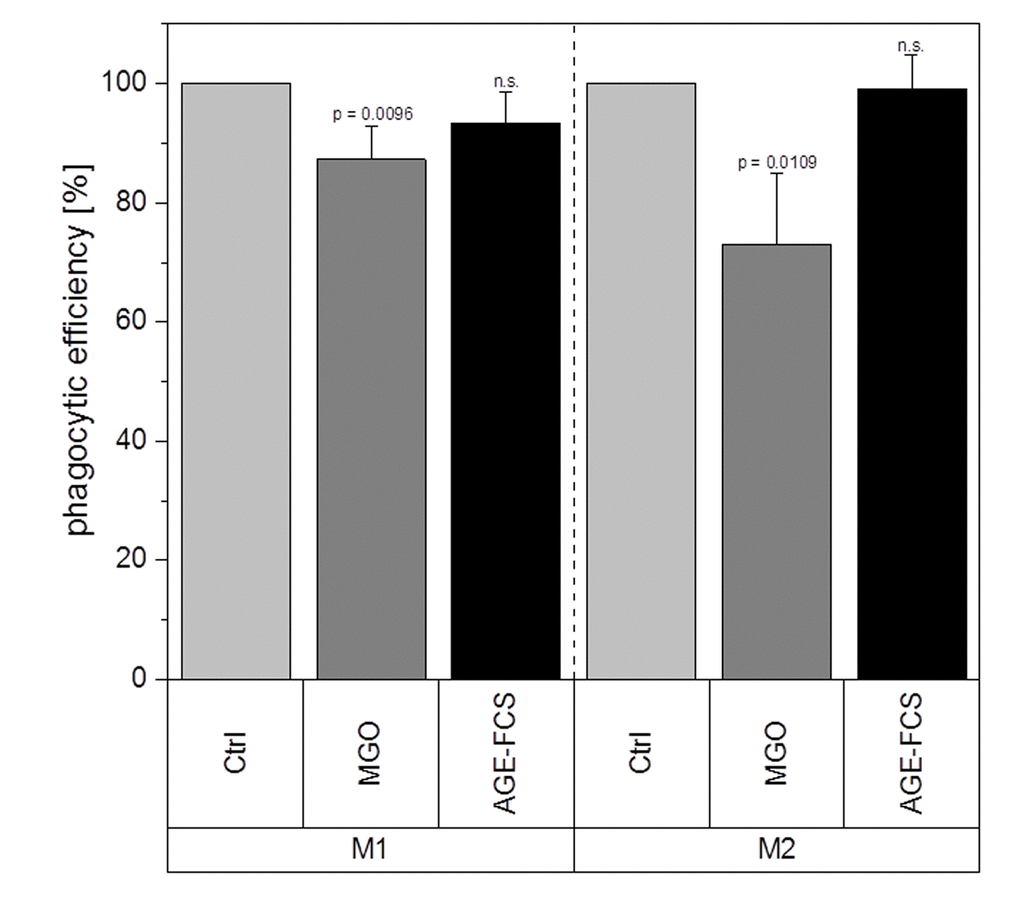
Figure 11.Phagocytic efficiency after glycation. THP-1 macrophages were glycated with 1 mM MGO or treated with 10% AGE-FCS for 24 h and polarized in M1 or M2 phenotype. Phagocytosis assay was performed with pHrodo™ Green E. coli BioParticles™. Data was normalized to untreated control cells. Graphs show average mean of phagocytic efficiency + SD of 5 independent experiments.