Submit an Article
Navigate
Home
Editorial Board
Editorial Policies
Current Volume
Archive
Scientific Integrity
Publication Ethics Statements
Interviews with Outstanding Authors
Newsroom
Sponsored Conferences
Podcast
Contact
Special Collections
Submit an Article
Online ISSN: 1945-4589
Priority Research Paper
|
Volume 11, Issue 14
|
pp. 4783–4800
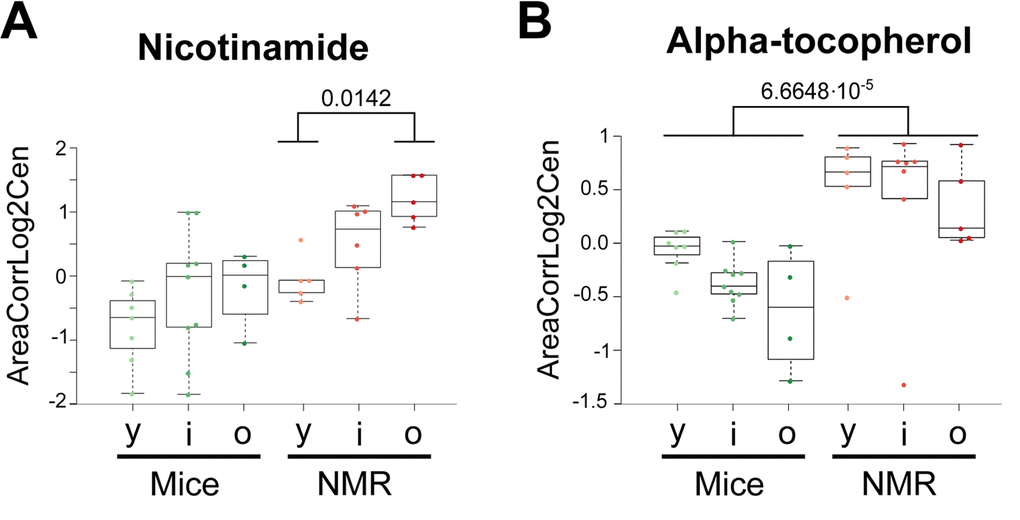
The metabolomic signature of extreme longevity: naked mole rats
versus
mice
Back to article
Figure 6
(6 of 7)
−
100%
+
Figure 6.
Vitamins that are elevated in naked mole-rats.
Statistical comparisons were calculated by means of a two-sided Wilcoxon test. P-values are indicated.