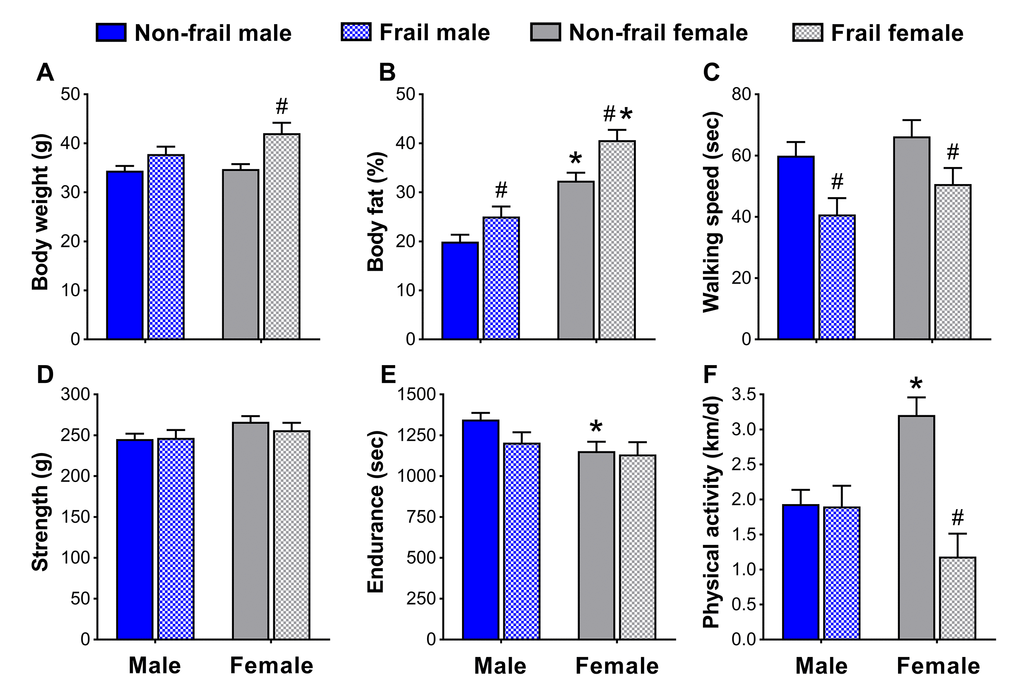
Figure 5.Body composition (A, B) and physical function (C-F) of non-frail and frail, male and female mice three months prior to the frailty assessment. *Significant difference between sex (p≤0.05). #Significant difference between frailty status within sex (i.e., non-frail vs. frail male, non-frail vs. frail female) (p≤0.05). Values are presented as mean + standard error.