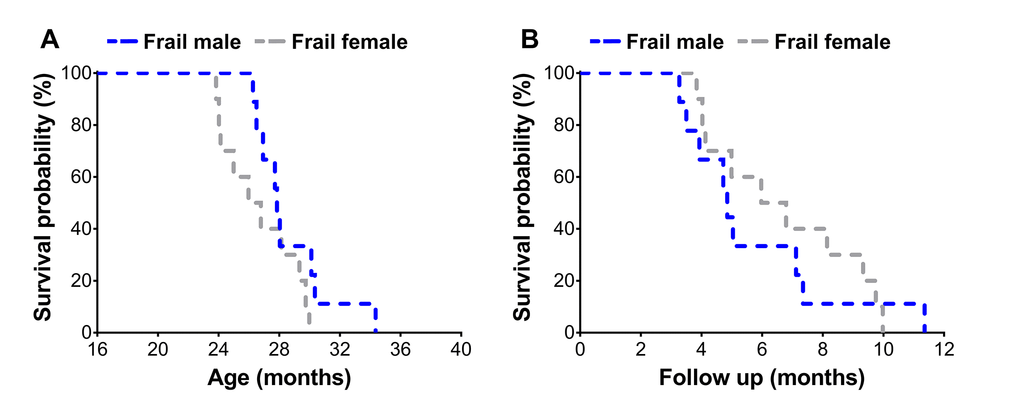
Figure 3.Survival curves of frail male (n=9) and female (n=10) mice. Mice were classified as frail according to the frailty criteria listed in Table 1, and survival was assessed across the lifespan (A) and also relative to the time of the frailty assessment (B).
Figure 3 — Sex-specific components of frailty in C57BL/6 mice | Aging