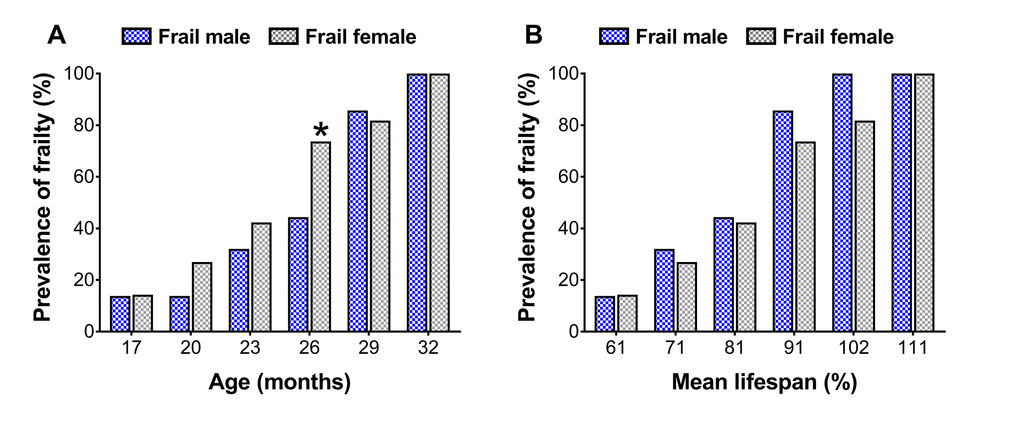
Figure 2.Prevalence of frailty in male and female mice at each time-point (A) and normalized to the mean lifespan for each respective sex (B). The number of frail mice varies by time-point (n=3-18). * Significant difference between sex (p≤0.05).
Figure 2 — Sex-specific components of frailty in C57BL/6 mice | Aging