Submit an Article
Navigate
Home
Editorial Board
Editorial Policies
Current Volume
Archive
Scientific Integrity
Publication Ethics Statements
Interviews with Outstanding Authors
Newsroom
Sponsored Conferences
Podcast
Contact
Special Collections
Submit an Article
Online ISSN: 1945-4589
Research Paper
|
Volume 11, Issue 14
|
pp. 5206–5214
Sex-specific components of frailty in C57BL/6 mice
Back to article
Figure 1
(1 of 5)
−
100%
+
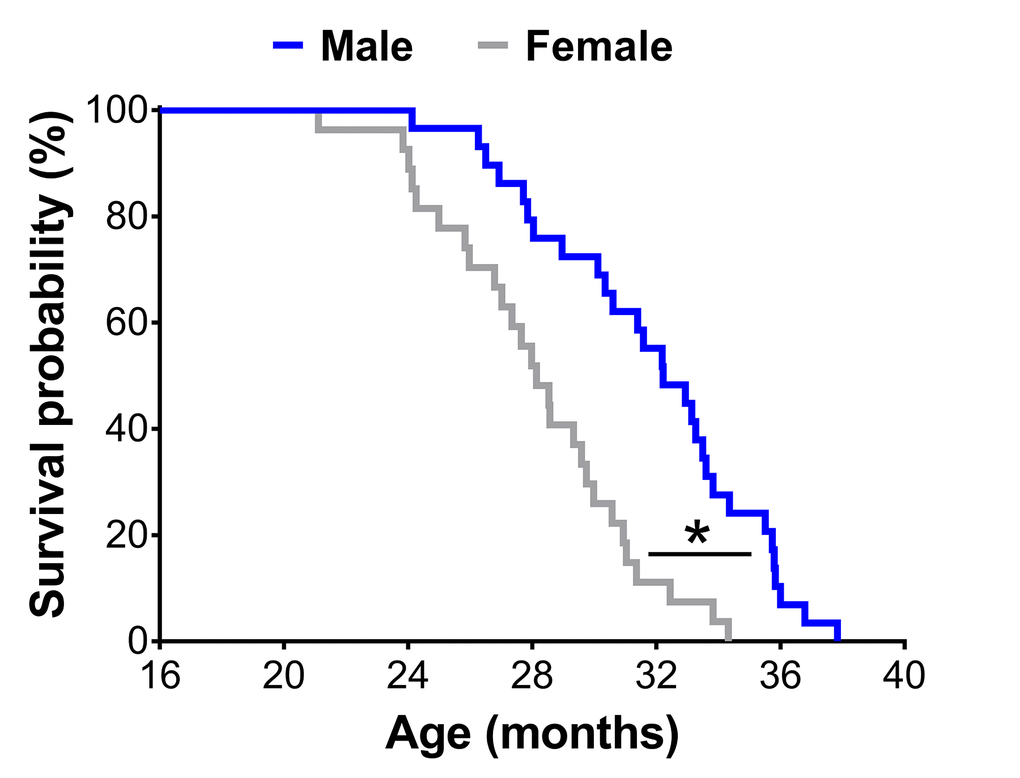
Figure 1.
Survival curves of male (n=29) and female (n=27) C57BL/6 mice in the original cohort. * Significant difference between sex (p≤0.05).
Figure 1 — Sex-specific components of frailty in C57BL/6 mice | Aging