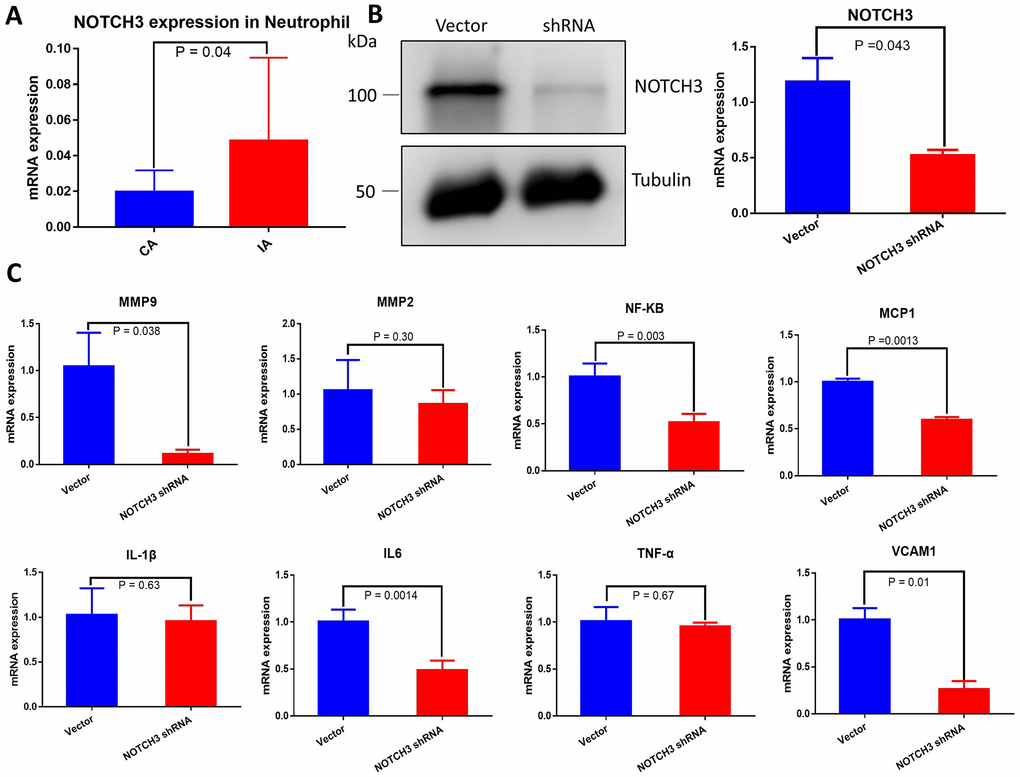
Figure 6.(A) Quantification of NOTCH3 transcription in peripheral blood neutrophils from samples with or without IA. (B) Western blot and RT-qPCR of whole cell lysate from HUVECs transduced with negative control shRNA or NOTCH3-shRNA. (C) Quantification of IA-related factor transcripts from HUVECs transduced with negative control shRNA or NOTCH3-shRNA.