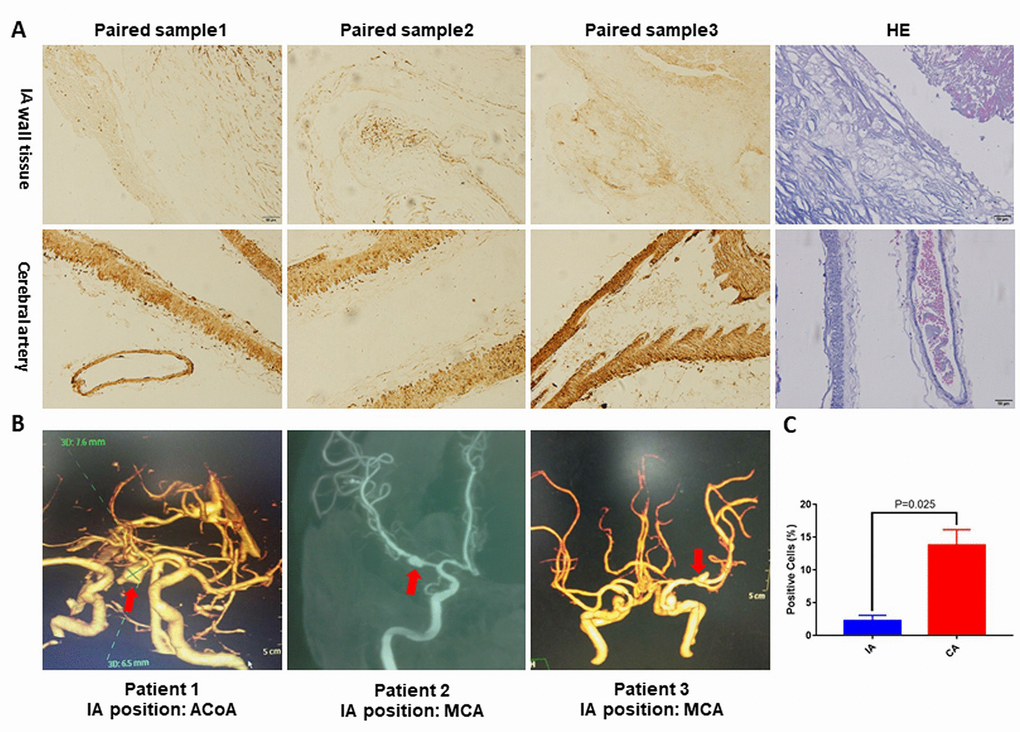
Figure 5.(A) Representative pictures of NOTCH3 immunohistochemistry staining or hematoxylin and eosin staining of IA and cerebral artery tissues. (B) Reconstructed images from diagnostic CTA and DSA scans. The red arrows indicate the location of the IA. (C) Percentage of positively stained cells in panel (A) as measured using Image J. ACoA: anterior communicating artery, MCA: middle cerebral artery. p<0.05.