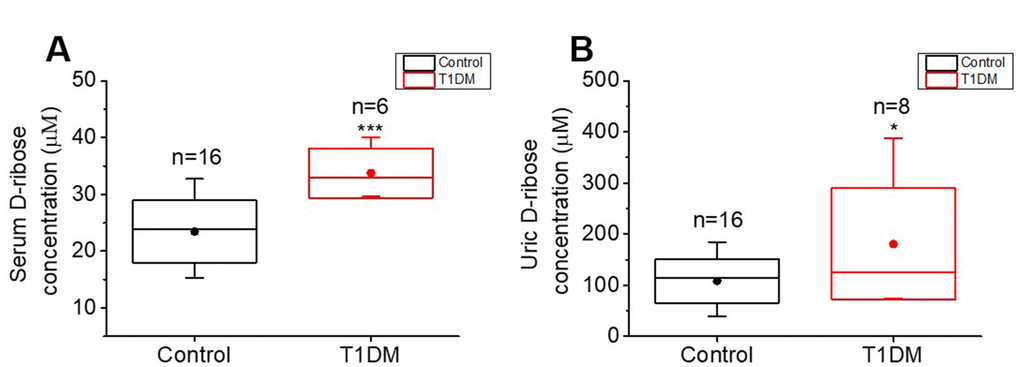
Figure 5.Comparison of D-ribose levels between T1DM patients and normal participants. Patients with T1DM (T1DM group) and age-matched normal participants (control group, n=16) were enrolled for determination of their D-ribose concentrations. D-ribose levels in serum (panel A) and urine (panel B) were measured by HPLC as previously described [17]. All values are shown as the mean ± S.E.M. *, P < 0.05; ***, P < 0.001.