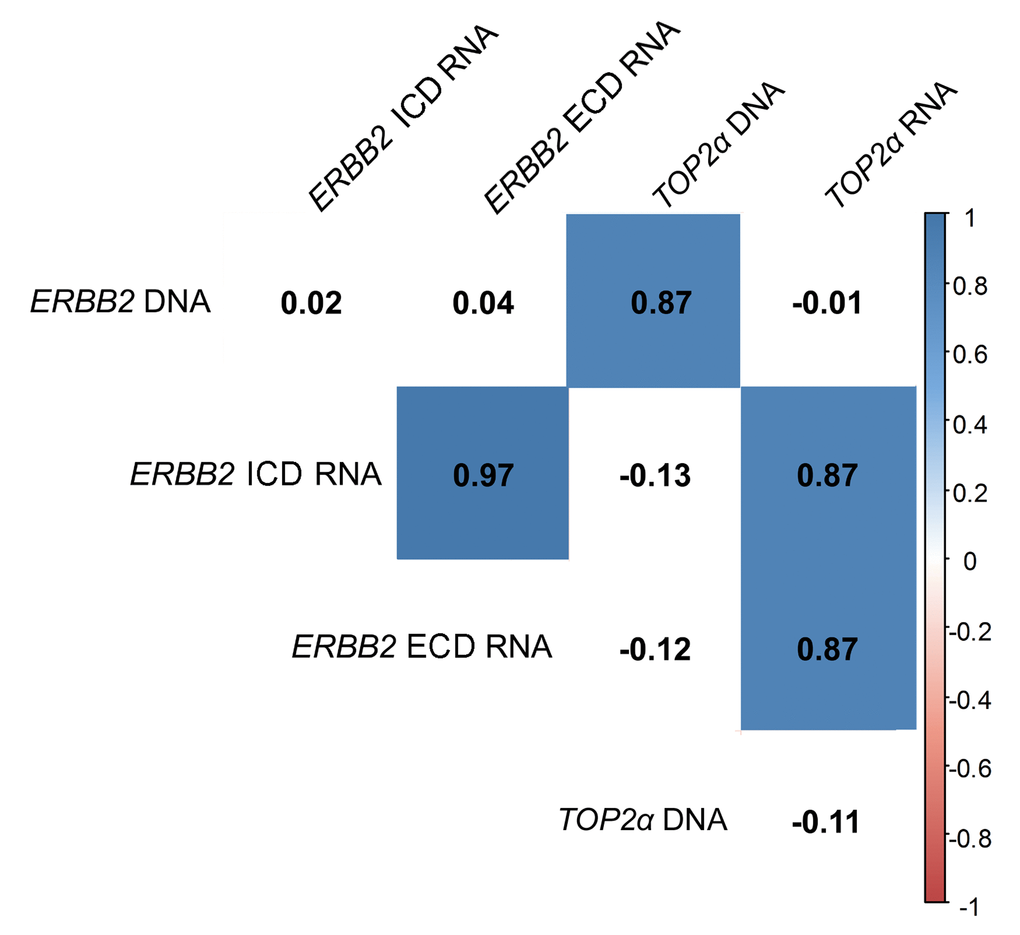
Figure 2.ERBB2 and TOP2α DNA and RNAs correlogram. Correlation among ERBB2 and TOP2α DNA and RNAs. This correlogram was obtained using the R software. As some analysis presented a different “n”, the data was simultaneously analyzed in GraphPad software and the r-values were corrected by the GraphPad values.