Submit an Article
Navigate
Home
Editorial Board
Editorial Policies
Current Volume
Archive
Scientific Integrity
Publication Ethics Statements
Interviews with Outstanding Authors
Newsroom
Sponsored Conferences
Podcast
Contact
Special Collections
Submit an Article
Online ISSN: 1945-4589
Research Paper
|
Volume 11, Issue 14
|
pp. 4836–4857
Effects of transcutaneous vagus nerve stimulation in individuals aged 55 years or above: potential benefits of daily stimulation
Back to article
Figure 9
(9 of 15)
−
100%
+
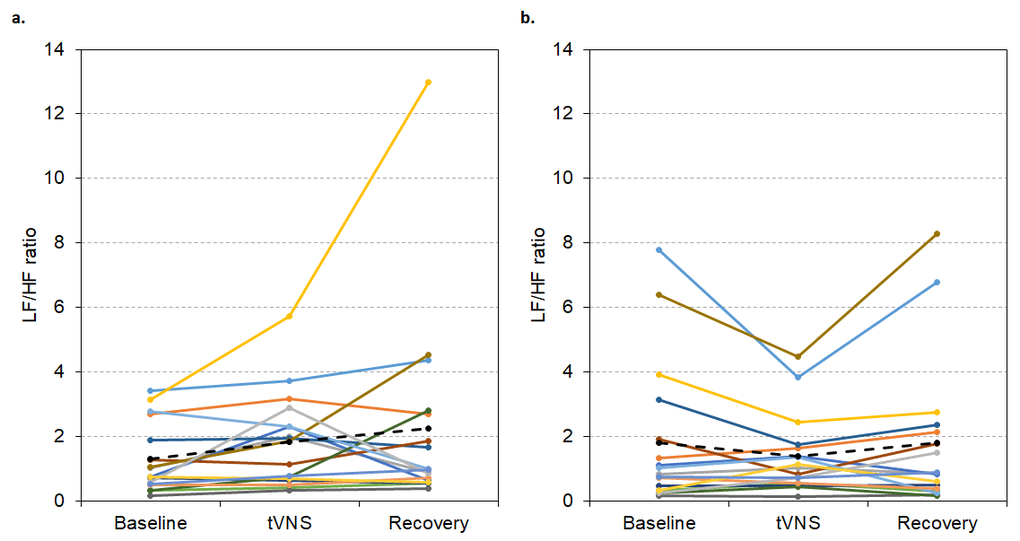
Figure 9.
LF/HF ratio values during visit 1 (
A
) and visit 2 (
B
) for each non-responder during baseline, tVNS and recovery. Dashed black line indicates the group mean.