Submit an Article
Navigate
Home
Editorial Board
Editorial Policies
Current Volume
Archive
Scientific Integrity
Publication Ethics Statements
Interviews with Outstanding Authors
Newsroom
Sponsored Conferences
Podcast
Contact
Special Collections
Submit an Article
Online ISSN: 1945-4589
Research Paper
|
Volume 11, Issue 14
|
pp. 4836–4857
Effects of transcutaneous vagus nerve stimulation in individuals aged 55 years or above: potential benefits of daily stimulation
Back to article
Figure 5
(5 of 15)
−
100%
+
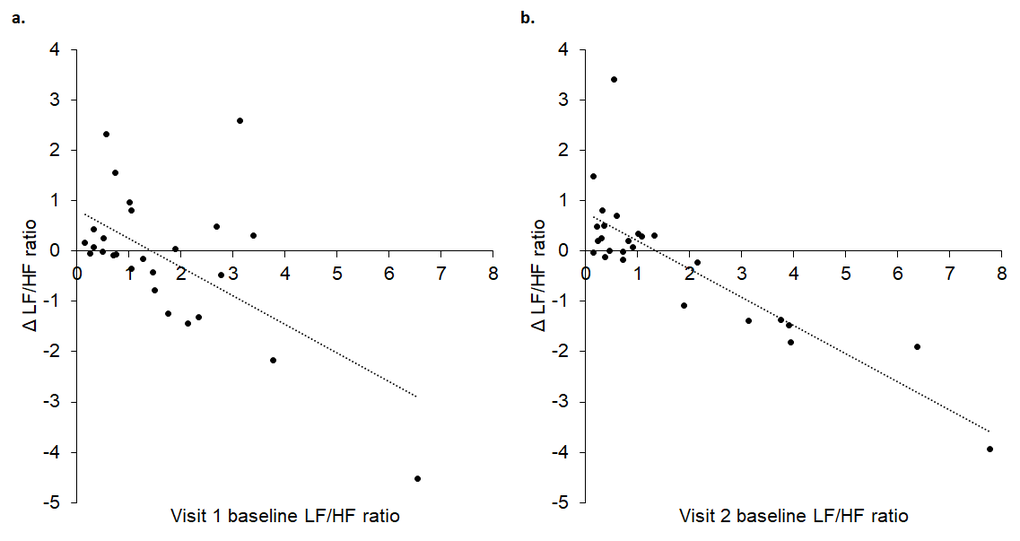
Figure 5.
Baseline LF/HF ratio in visits 1 (
A
) and 2 (
B
) significantly predicted change in LF/HF ratio between baseline and tVNS. Δ refers to the differences between baseline and tVNS.