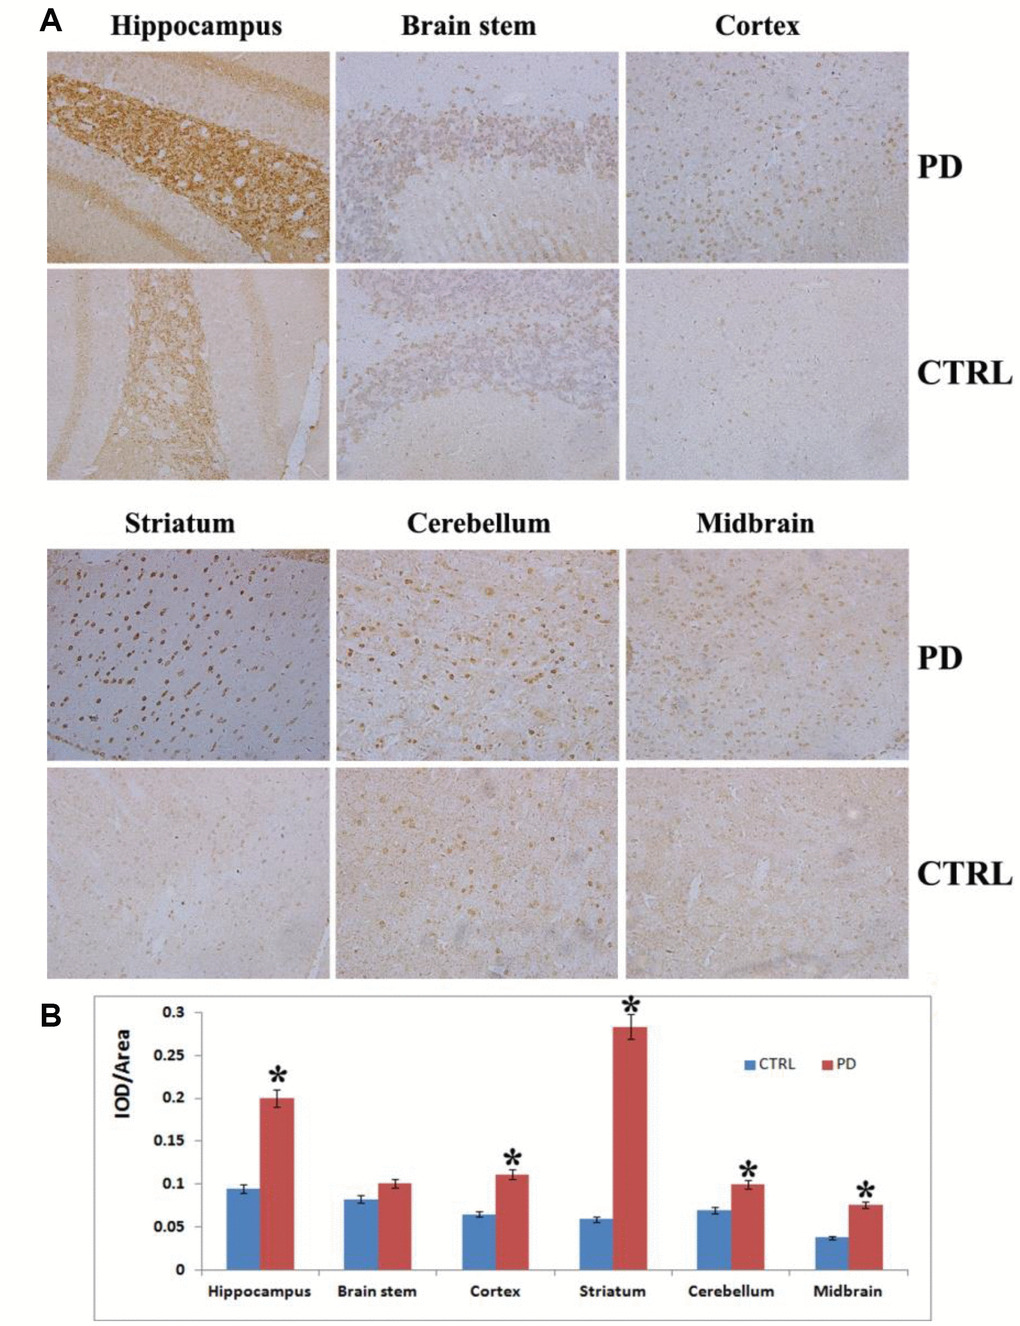
Figure 2.Analysis on α-synuclein expression and aggregation in various brain areas. (A) Representative images showing IHC staining for α-synuclein in the hippocampus, striatum, cortex, midbrain, cerebellum and brain stem (magnification: 100x). (B) Densitometric analysis of α-synuclein levels in the indicated brain areas. Bars depict the mean±SD; *p<0.05.