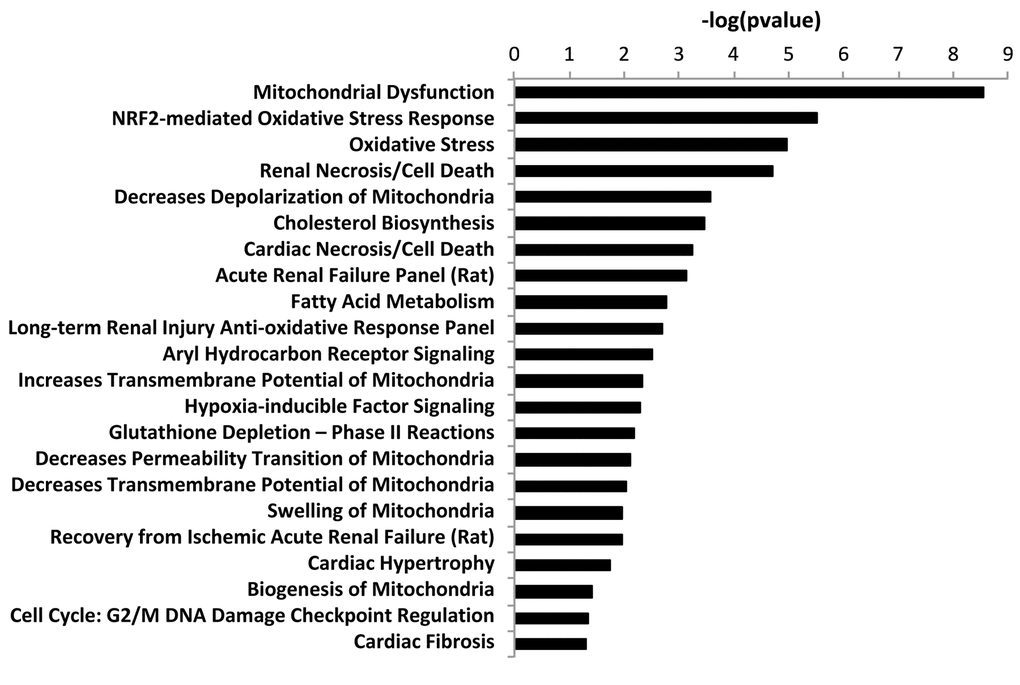
Figure 4.“Toxicity” effects of differentially expressed proteins in co‐cultures versus monocultures. Ingenuity Pathway Analysis showed toxicity functions significantly enriched by the proteins differentially expressed in co‐cultures (p < 0.05). The p value for each pathway is indicated by the bar and is expressed as ‐1 times the log of the p value.