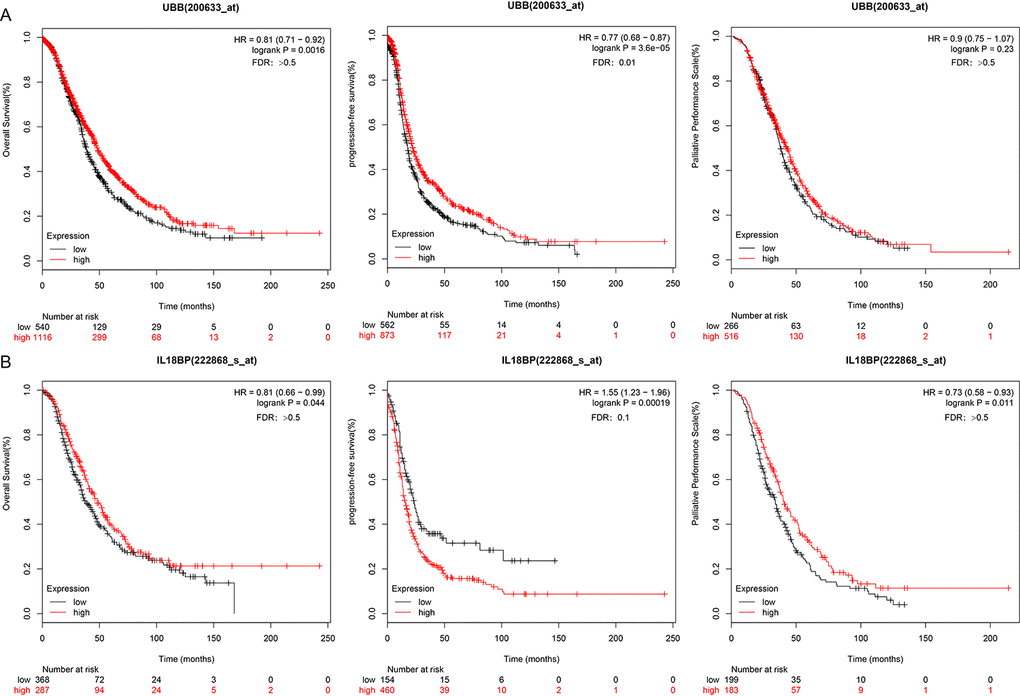
Figure 8.UBB and IL18BP gene survival curves in the KMplot dataset. (A) OS, PFS, and PPS curves for the UBB gene in a dataset from the KMplot database. Survival time is plotted on the x-axis; OS, PFS, and PPS are plotted on the y-axis. (B) OS, PFS, and PPS curves for the IL18BP gene in the KMplot dataset. Survival times are plotted on the x-axes; OS, PFS, and PPS are plotted on the y-axes. Differences were identified using the log rank P test.