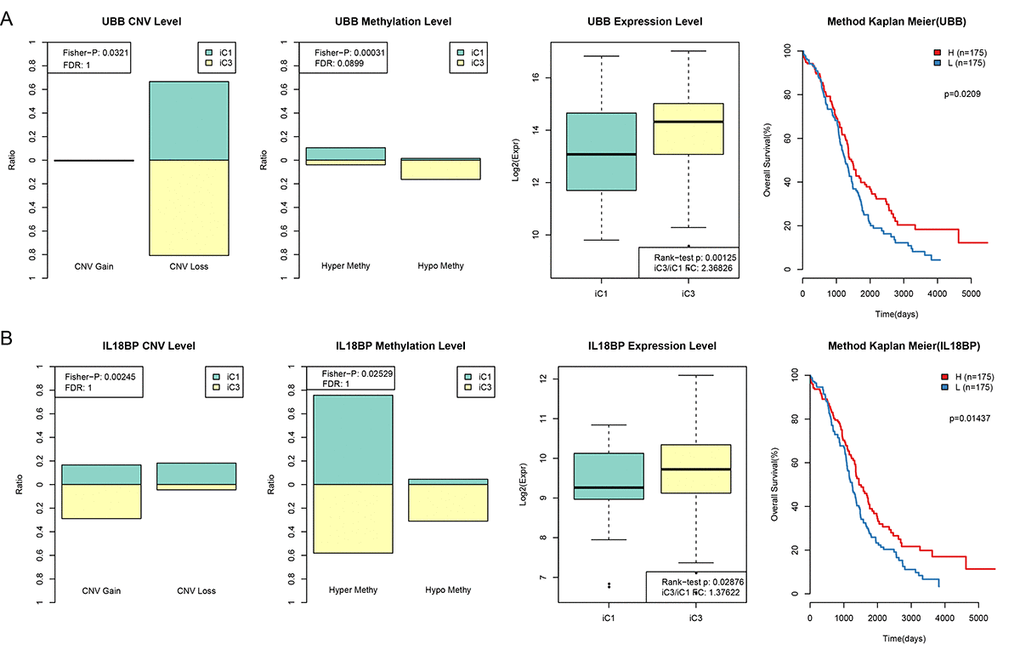
Figure 7.CNV and MET in UBB and IL18BP were significantly correlated with prognosis. (A) Comparison of CNV, MET, and EXP in the UBB gene between iC1 and iC3 subtypes and prognostic survival curve for the TIMM50 gene. From left to right: the proportion of UBB Gain and Loss (range: 0-1) in iC1 and iC3 samples, the proportion of UBB hypermethylation and hypomethylation (range: 0-1) in iC1 and iC3 samples, UBB expression in iC1 and iC3 samples, and survival curve with samples divided into high and low UBB groups based on median gene expression level. (B) Comparison of CNV, MET, and EXP in the IL18BP gene between iC1 and iC3 subtypes and prognostic survival curve for the TIMM50 gene. From left to right: the proportion of IL18BP Gain and Loss (range: 0-1) in iC1 and iC3 samples, the proportion of IL18BP hypermethylation and demethylation (range:0-1) in iC1 and iC3 samples, IL18BP expression in iC1 and iC3 samples, and survival curve with samples divided into high and low IL18BP groups based on median gene expression level. Survival time is shown on the x-axis and overall survival is shown on the y-axis; differences were identified using the log rank P test.