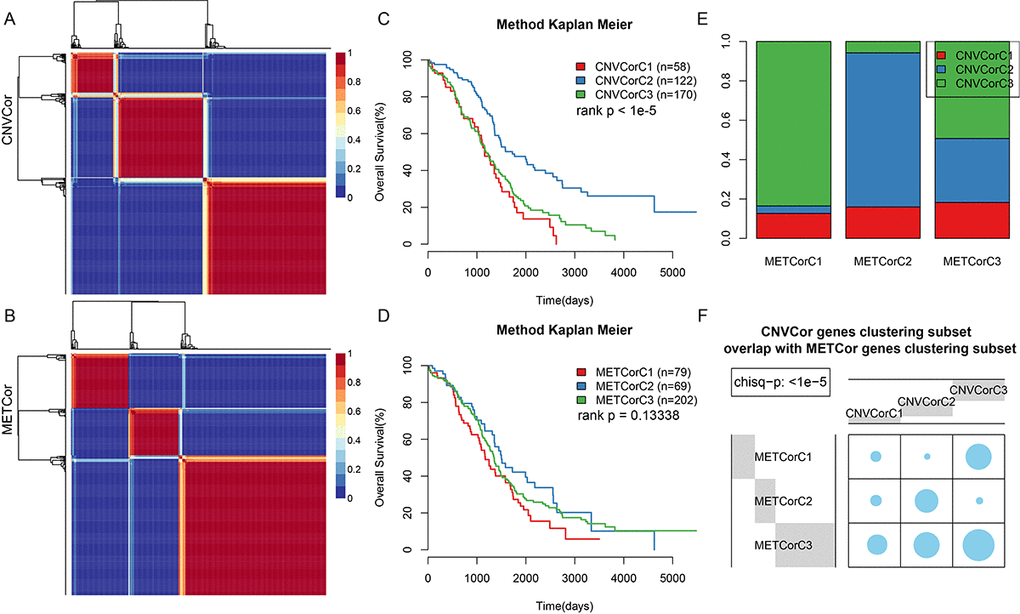
Figure 2.Identification of ovarian carcinoma molecular subtypes based on CNVcor and METcor genes. (A) NMF clustering results for CNVcor genes. (B) NMF clustering results for METcor genes. (C) KM survival curve for CNVcor gene clustering subsets. Survival time is shown on the x-axis, and survival rate determined by log rank P test is shown on the y-axis. (D) KM survival curve for METcor gene clustering subsets. Survival time is shown on the x-axis and survival rate determined by log rank P test is shown on the y-axis. (E) Overlap between CNVcor and METcor gene clustering subsets. F: Overlap test for CNVcor and METcor gene clustering subsets. Blue circles represent the proportion of overlapping samples between two the clusters; significance was determined using the Kolmogorov-Smirnov test.