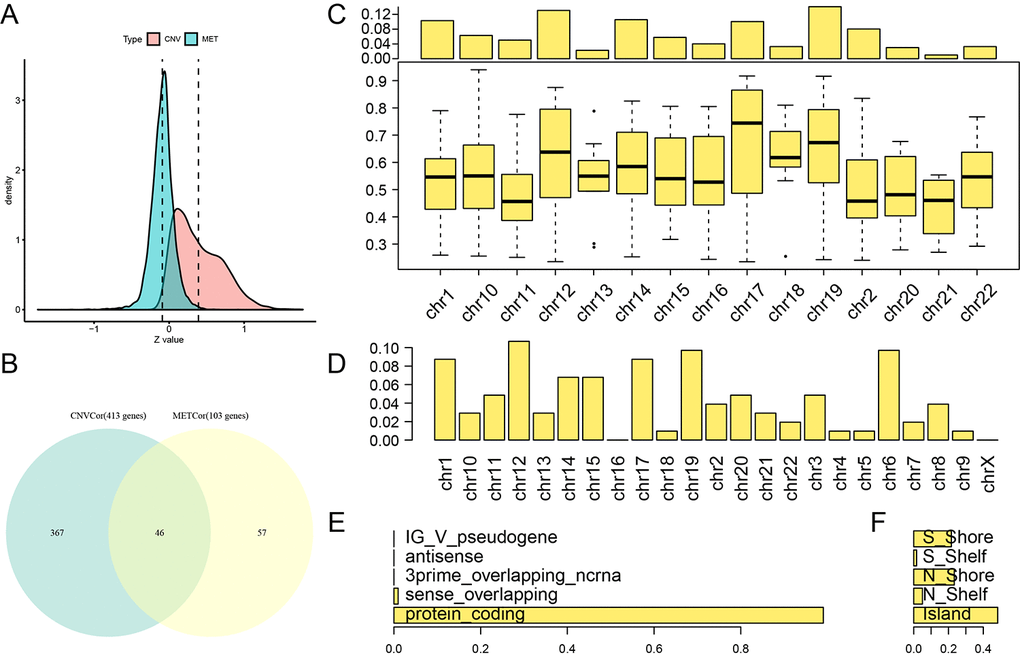
Figure 1.Identification of DNA copy number-correlated (CNVcor) and DNA methylation-correlated (METcor) genes in ovarian carcinoma. (A) Correlation z-value distributions for CNVcor genes and METcor genes. Density distribution is shown on the y-axis; the dotted line represents the median CNV and MET correlation coefficient values. (B) Venn diagram of overlapping CNVcor genes and METcor genes. The green area represents the 413 CNVcor genes. The yellow area represents the 103 METcor genes. The overlapping region contains 46 genes. (C) Box plot of CNVcor gene chromosomal distribution (upper figure) and correlations (lower figure). In the top image, the proportion of CNVcor genes on each chromosome (adding to a total of 1) is shown on the y-axis; in the bottom image, the correlation coefficient of CNVcor genes on each chromosome is shown on the y-axis. (D) Box plot of METcor gene chromosomal distribution. The proportion of METcor genes on each chromosome is shown on the y-axis. (E) METcor gene types. The proportion of METcor genes by type is shown on the x-axis. F: Distribution of MET loci. The proportion of types of methylated loci is shown on the x-axis.