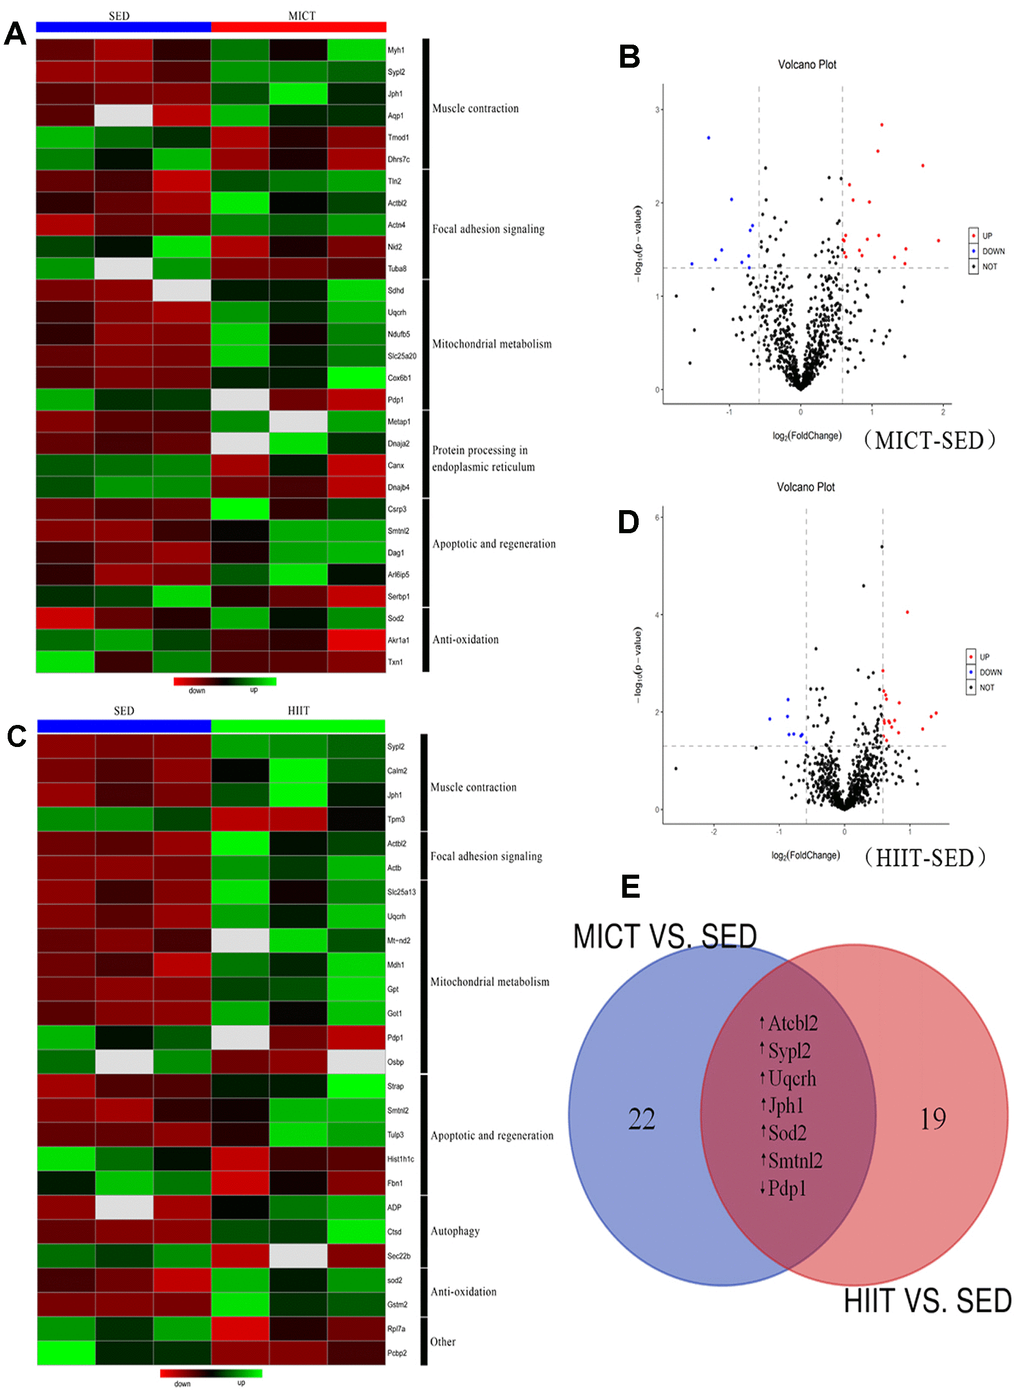
Figure 2.Relative protein abundances in the red gastrocnemius muscle of rats in the MICT, HIIT, and SED groups. (A) Heat map and (B) volcano plot of significantly up- and downregulated proteins in the red gastrocnemius muscle from MICT and SED rats (p < 0.05, fold change > ± 1.5). (C) Heat map and (D) volcano plot of significantly up- and downregulated proteins in the red gastrocnemius muscle from HIIT and SED rats. (E) Overlap of proteins up- and downregulated following different modes of exercise training compared with their levels in the SED group.