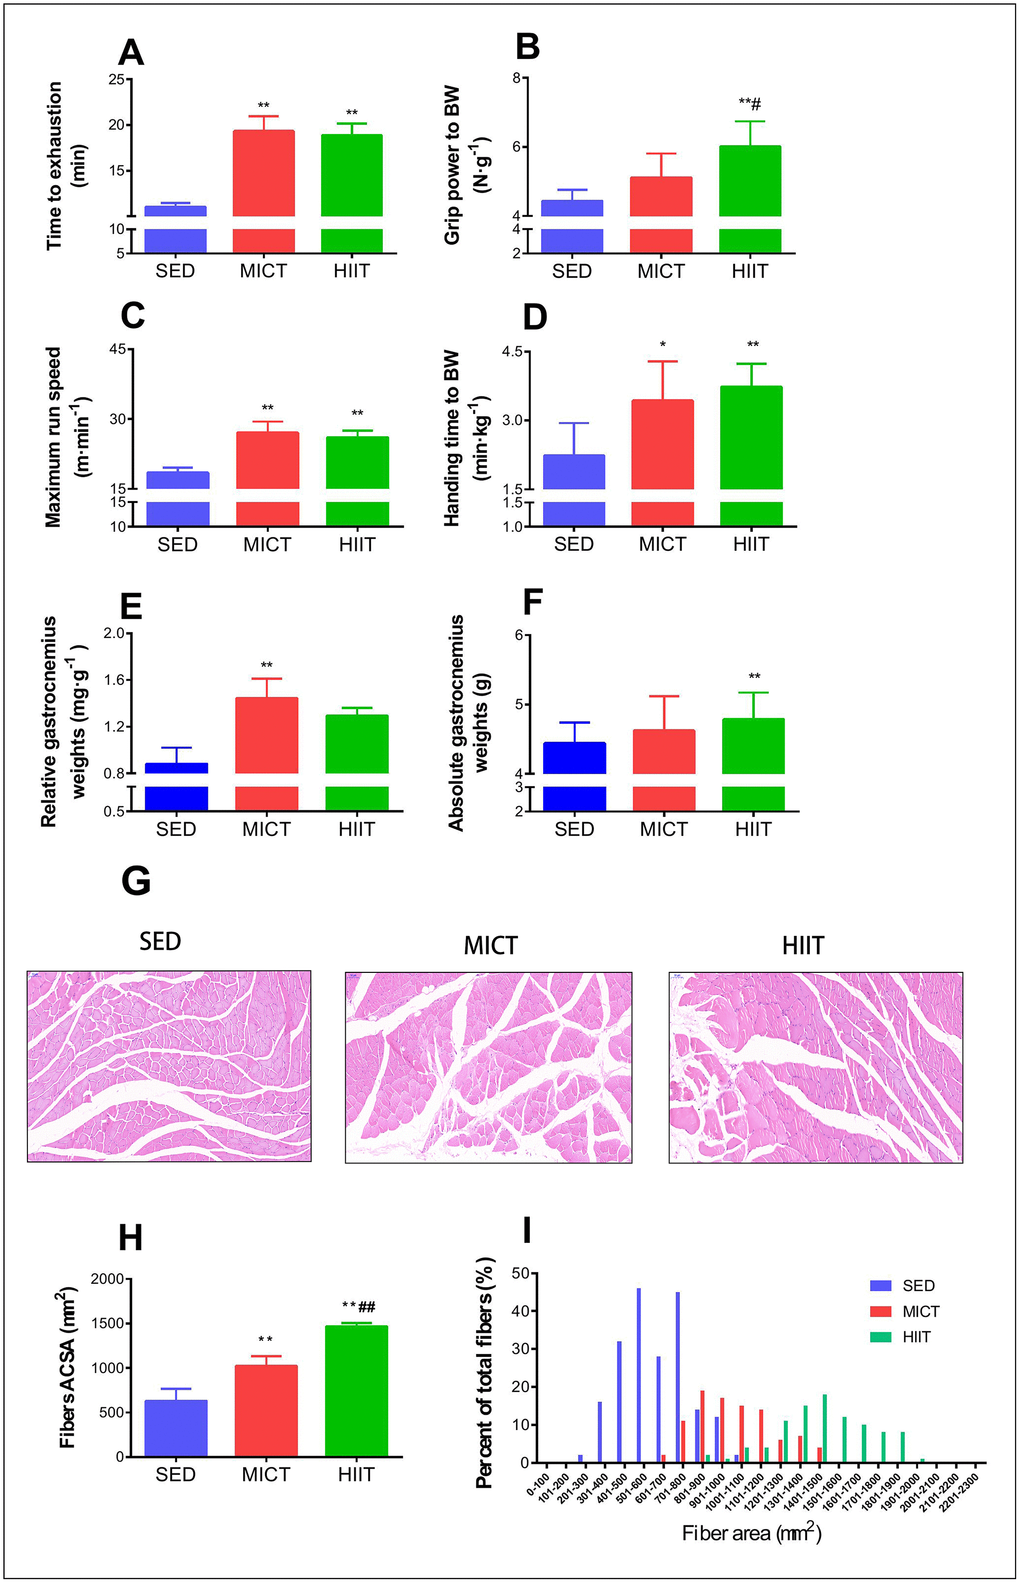
Figure 1.Effect of MICT and HIIT protocols on physical performance and fiber cross sectional area. Changes in time to exhaustion (min) (A), grip strength (N·g–1) (B), maximum run speed (m·min-1) (C), inclined plane performance (D), relative gastrocnemius weight (E), absolute gastrocnemius weight (F), muscle fiber morphology (G), mean cross-sectional area (H), and frequency distribution of mean gastrocnemius fiber cross sectional area (I). SED, sedentary control; MICT, moderate-intensity continuous training; HIIT, high-intensity interval training; BW, body weight. Data were analyzed by one-way ANOVA followed by Tukey’s post-hoc test and are presented as mean ± SD. * p < 0.05 vs. SED; ** p < 0.01 vs. SED; # p < 0.05 vs. MICT.