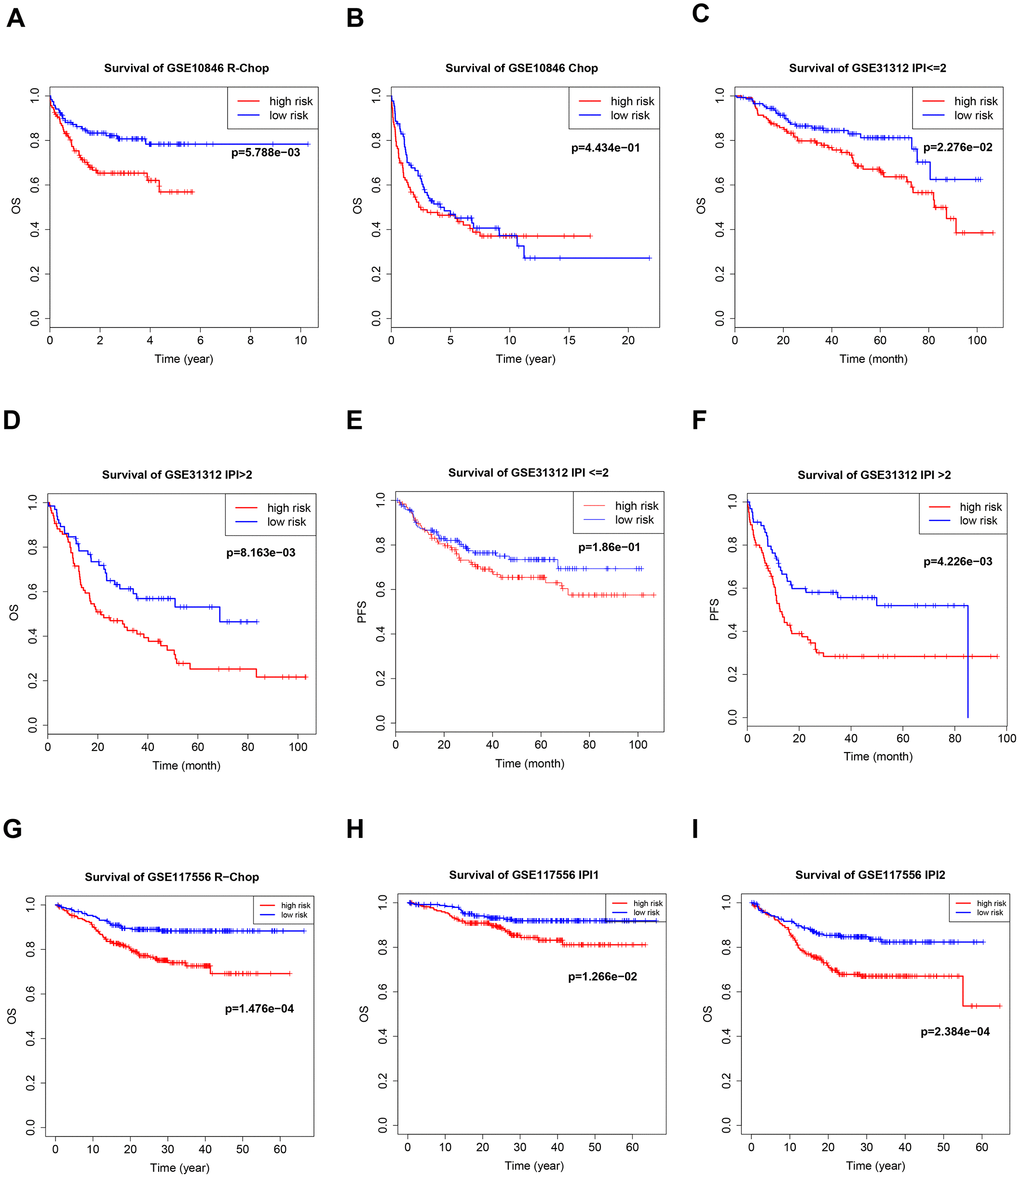
Figure 6.Kaplan–Meier curves of overall survival (OS) in high-risk and low-risk patients treated with cyclophosphamide, doxorubicin, vincristine, and prednisone (CHOP) (B) or CHOP plus rituximab (R-CHOP) (A, G). Kaplan–Meier curves of overall survival (OS) and PFS in high-risk and low-risk patients with different international prognostic index (IPI) values (C–F, H, I).