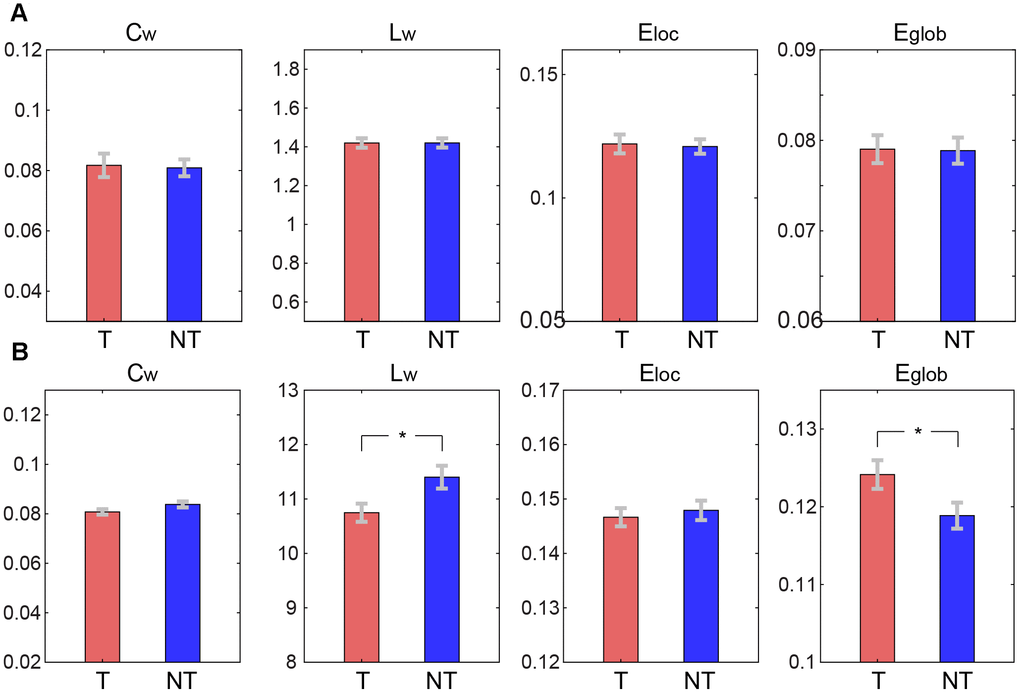
Figure 2.Comparisons of global graph theoretical metrics between tea drinking (T) and non-tea drinking groups (NT). (A) Metrics computed on the functional connectivity network. (B) Metrics calculated on the structural connectivity network. Asterisks represent significance level obtained by permutation test (* corrected p< 0.05).