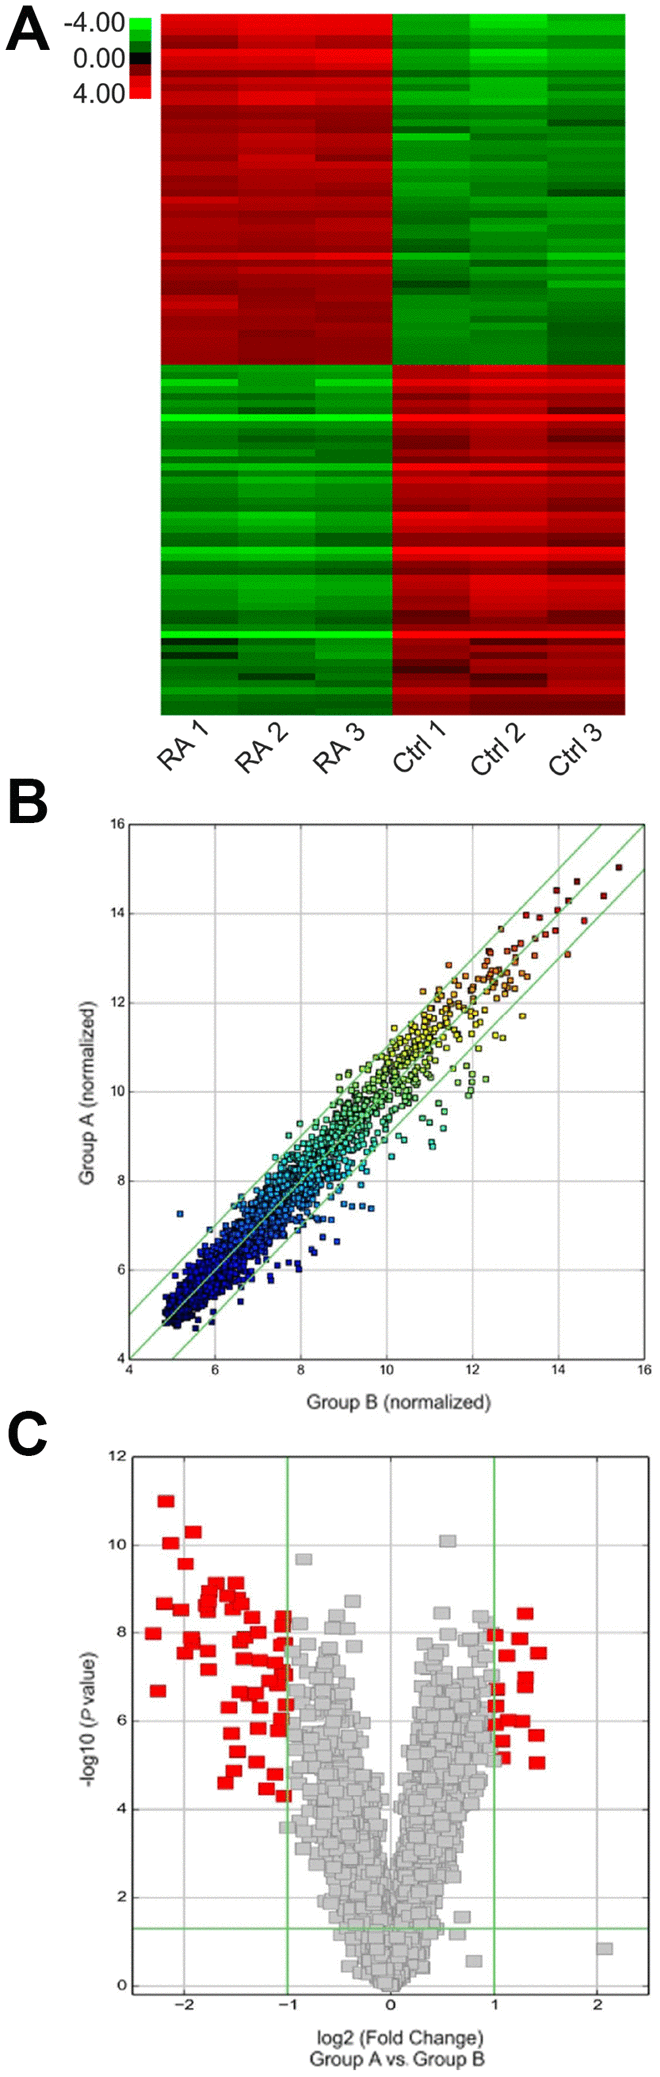
Figure 1.Expression of various circRNAs in the cartilage tissue of RA patients. (A) Hierarchical clustering assessment of circRNAs that displayed variation in expression patterns between control and RA groups; every group comprised three individuals (over two-fold difference in expression; P < 0.05). Expression values are shown in various colors suggestive of high and low median expression levels. (B) Scatter plot was used to evaluate alterations in circRNA expression between control (group A) and RA (group B) specimens. Values corresponding to X and Y axes in the scatter plot were normalized signal values of specimens (log2 scaled). Green lines indicate fold alterations. CircRNAs over the top green line and below the bottom green line indicate over two-fold changes. (C) Volcano plots were built to show fold change values and P values. The vertical lines show two-fold upregulation and downregulation between control and RA specimens (A versus B), and the horizontal line shows P value. The red point in the plot shows various expression patterns of circRNAs with statistical significance.