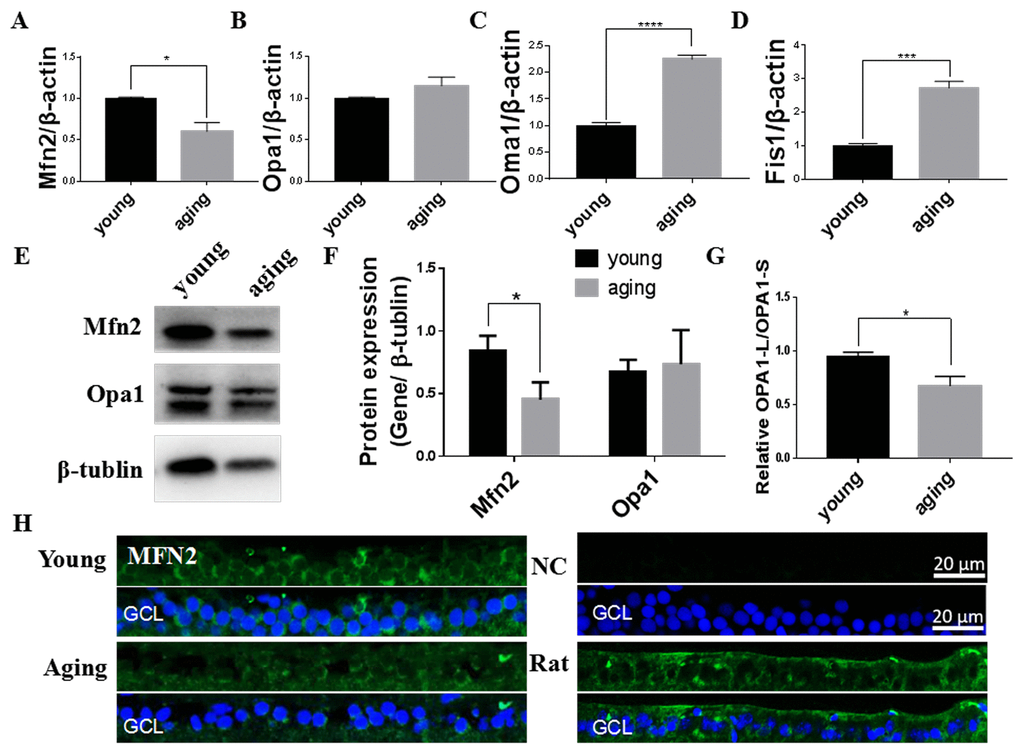
Figure 2.Mitochondrial fusion/fission imbalanced in aging zebrafish retinas. (A-D) Mfn2, Opa1, Oma1, and Fis1 expression in young and aging zebrafish retinas. Graphs represent (A) Mfn2, (B) Opa1, (C) Oma1, and (D) Fis1 gene expression by quantitative real-time PCR (mean ± SEM, *P<0.05, ***P<0.001, ****P<0.0001, n=3. (E) Representative western blot showing the protein expression levels of Mfn2 and Opa1 in young and aging zebrafish retinas. (F) The graph depicts the densitometric mean and SEM normalized to the corresponding level of the loading control protein beta-tubulin (*P<0.05, n=3). (G) The ratio of Opa1-L/Opa1-S, as determined by densitometry of western blots as in E (*P<0.05, n=3. (H) Immunofluorescence localization and relative expression of Mfn2 in the RGC layer of young and aging zebrafish retina cross-sections. All photographs were taken at 40x magnification except rat sections were at 20x magnification. Young, 4-6 months old zebrafish; aging, 19-23 months old zebrafish; NC, negative control (no primary antibody); Rat, rat retina positive control; Opa1-L, Opa1 long segment; Opa1-S, Opa1 short segment; GCL, ganglion cell layer.