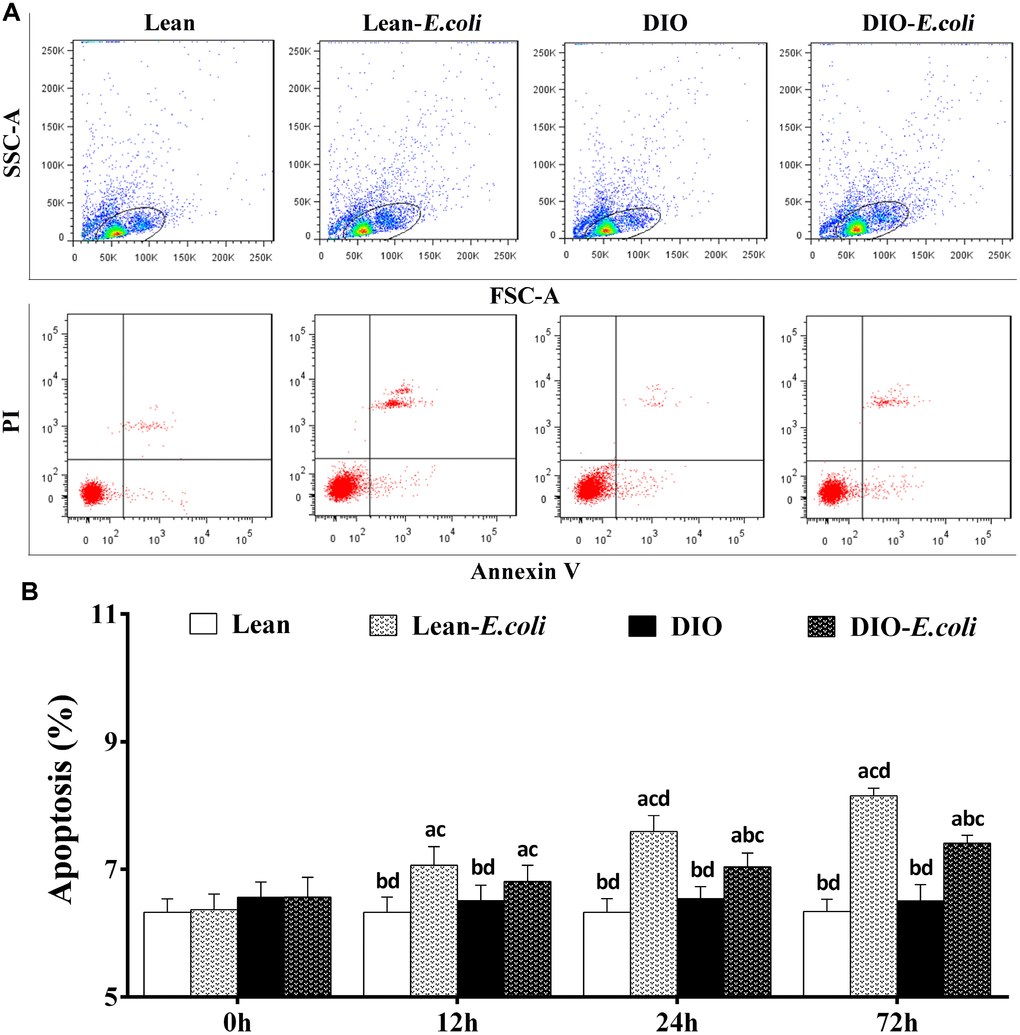
Figure 6.The percentages of hepatic apoptosis after E. coli infection. (A) The representative scatter gram of hepatic apoptosis at 72h after receiving intranasal instillations. (B) Hepatic apoptosis percentages. Note: Letter a, b, c or d represent difference (p<0.05) between the group and the lean group, lean-E. coli group, DIO group, or DIO-E. coli group, respectively.