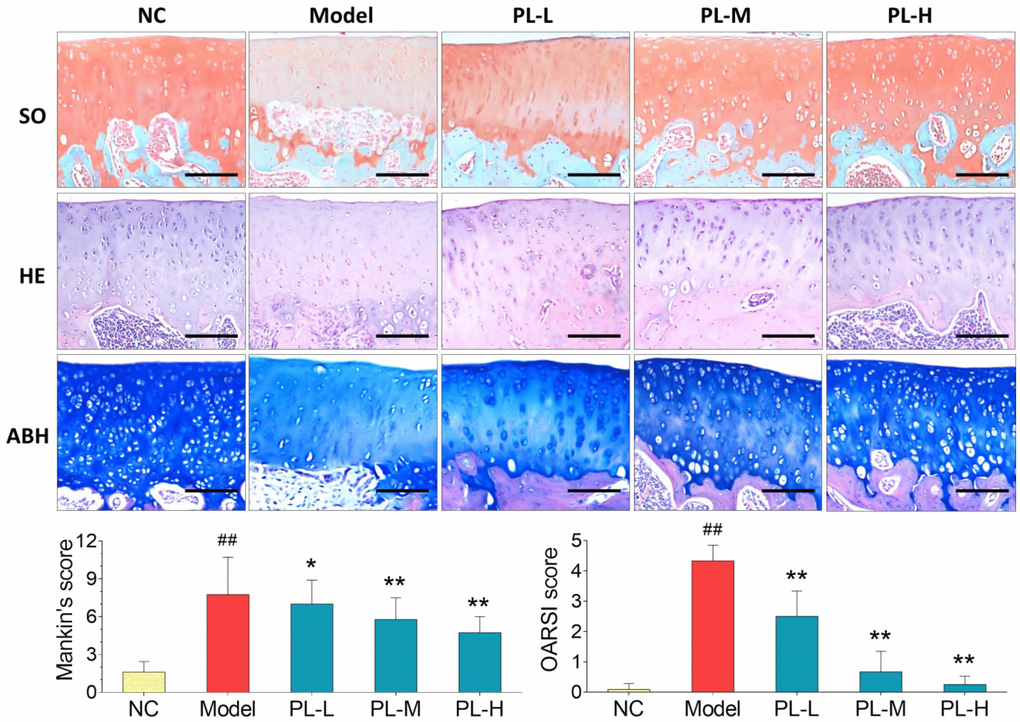
Figure 3.Observation of histopathological stainings (HE, SO, and ABH) with Mankin′s scoring and OARSI scoring of rat joints. Values are shown as mean ± SD. ##P < 0.01 vs. NC group; *P < 0.05 or **P < 0.01 vs. model group. Scale bar = 100 μm.
Figure 3 — Chondroprotective effects of platelet lysate towards monoiodoacetate-induced arthritis by suppression of TNF-α-induced activation of NF-ĸB pathway in chondrocytes | Aging