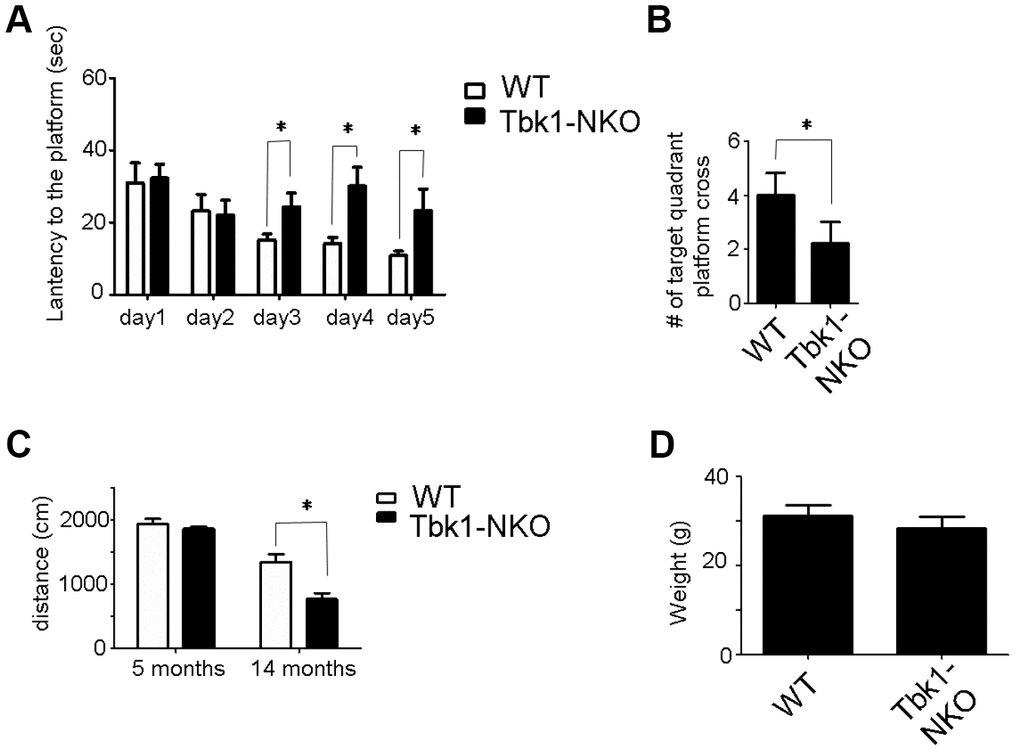
Figure 3.Behavioral evaluation of 14-month-old Tbk1-NKO mice. (A–B) Latency to reach the platform and number of target quadrant crosses in the Morris water maze (n = 9-10). *P < 0.05, compared to WT control. (C–D) Swimming distances and body weight (n = 9-10). *P < 0.05, compared to WT mice.