Submit an Article
Navigate
Home
Editorial Board
Editorial Policies
Current Volume
Archive
Scientific Integrity
Publication Ethics Statements
Interviews with Outstanding Authors
Newsroom
Sponsored Conferences
Podcast
Contact
Special Collections
Submit an Article
Online ISSN: 1945-4589
Research Paper
|
Volume 11, Issue 9
|
pp. 2610–2627
A novel mRNA-miRNA-lncRNA competing endogenous RNA triple sub-network associated with prognosis of pancreatic cancer
Back to article
Figure 3
(3 of 9)
−
100%
+
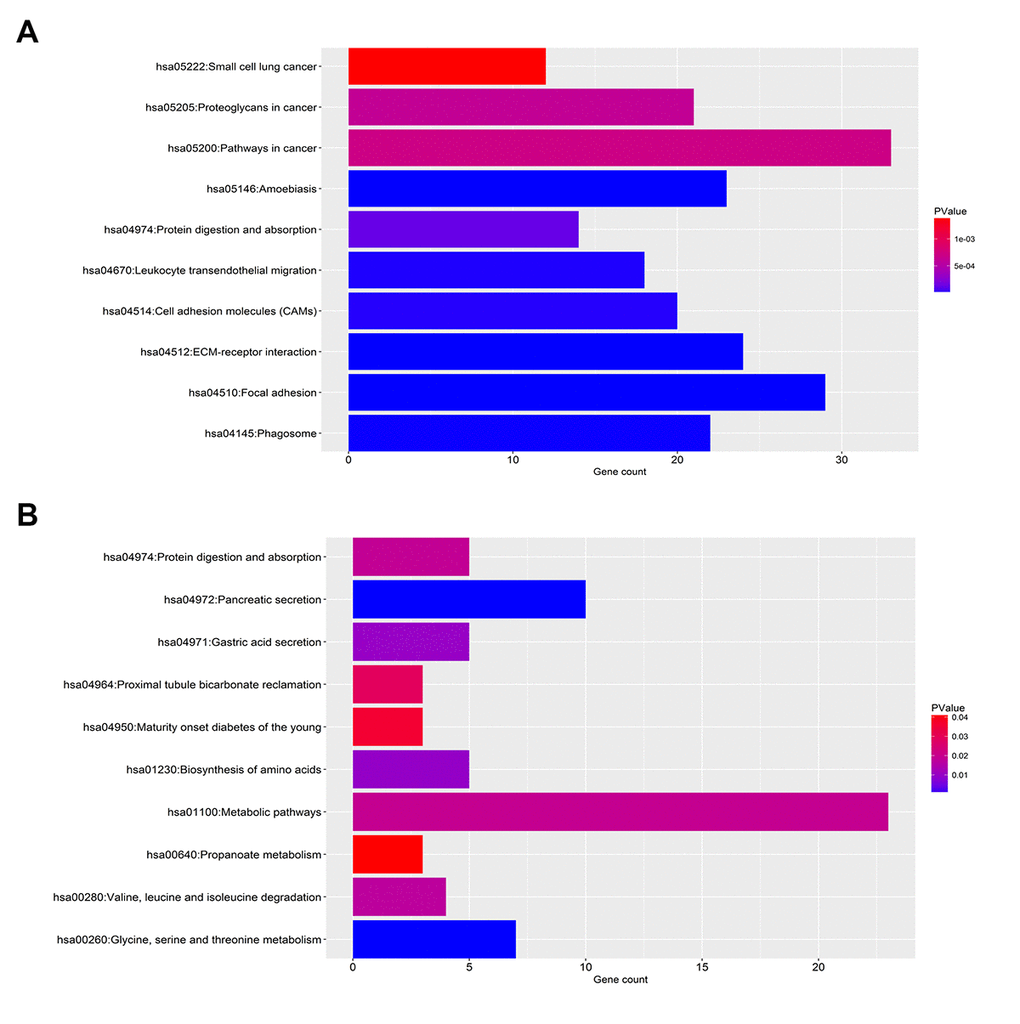
Figure 3.
KEGG pathway enrichment analysis for the significant DEGs.
(
A
) The top ten enriched KEGG pathways of the upregulated significant DEGs. (
B
) The top ten enriched KEGG pathways of the downregulated significant DEGs.