Submit an Article
Navigate
Home
Editorial Board
Editorial Policies
Current Volume
Archive
Scientific Integrity
Publication Ethics Statements
Interviews with Outstanding Authors
Newsroom
Sponsored Conferences
Podcast
Contact
Special Collections
Submit an Article
Online ISSN: 1945-4589
Research Paper
|
Volume 11, Issue 8
|
pp. 2352–2368
Identification of noncoding RNA expression profiles and regulatory interaction networks following traumatic spinal cord injury by sequence analysis
Back to article
Figure 3
(3 of 8)
−
100%
+
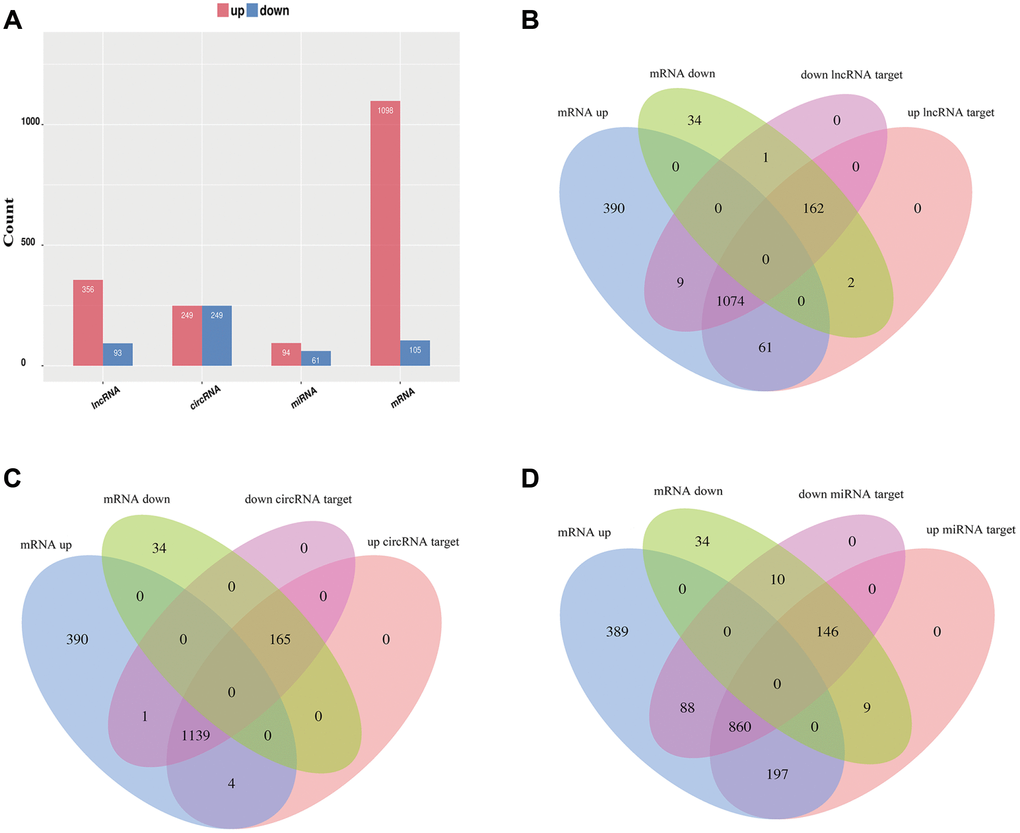
Figure 3.
Overview of relative differential expression of ncRNAs.
(
A
) Histogram showing the number of dysregulated ncRNAs and mRNAs. (
B
–
D
) Venn diagram showing the overlap between the target mRNAs of dysregulated ncRNAs and dysregulated mRNAs.