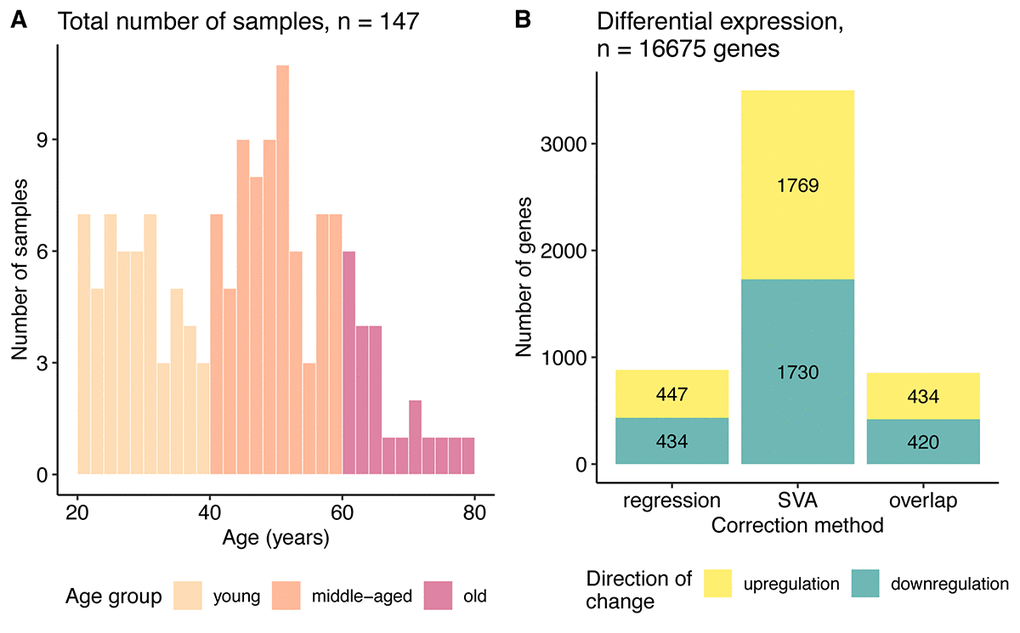
Figure 1.Data characterization. (A) Age distribution of the samples used in the study. (B) Bar plot of the number of genes differentially expressed with aging identified after regression and SVA correction and their overlap. The color represents direction of change: yellow – genes upregulated and blue – downregulated with age.