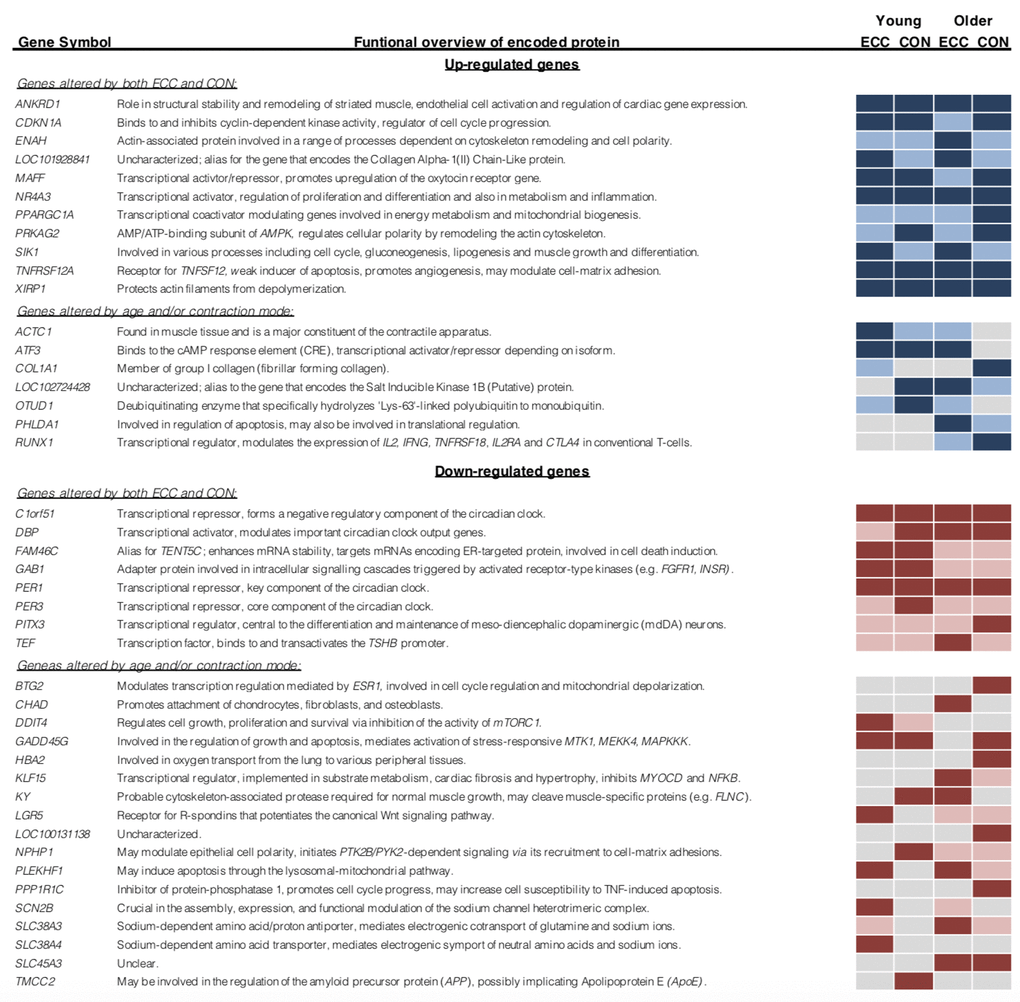
Figure 5.Top 10 ranked differentially expressed genes, classified by contraction mode and age group. Light blue/ red shading denotes gene differential expression for that condition (P<0.05). Dark blue/ red shading indicates gene falls within the top 10 log-fold change ranked differentially expressed genes for that condition.