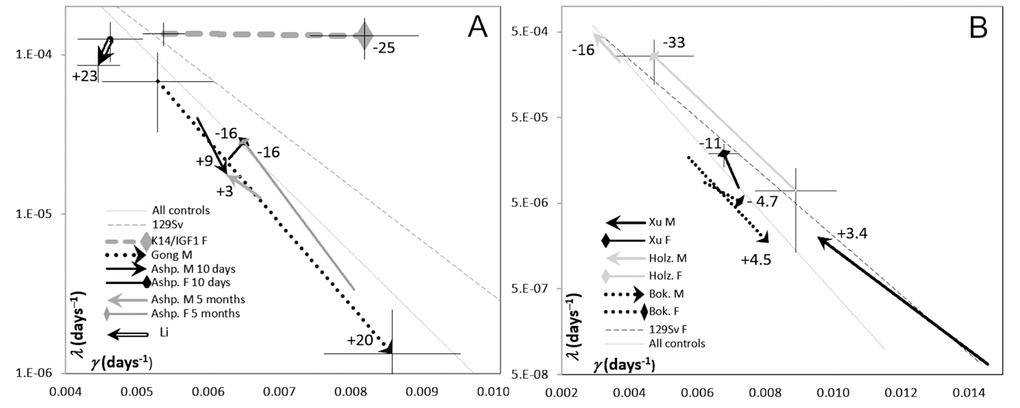
Figure 5.The plots of μ0 (log scale) vs. γ (linear scale) estimates derived from survival curves presented in publications where the effects of modification of IGF1 signaling in adults were reported. The heads of vectors are directed towards increased IGF1 signaling. The numbers at vector heads show reported percent changes in the median lifespans. Thin lines show the reference regressions of μ on γ, related to controls described in these publications and to 129/Sv mice (the same as in Figure 4). Crosshairs show 95% CI for the estimates of GM parameters. To avoid cluttering, crosshairs are added only to selected data points that illustrate the whole range of the CIs. (A) Different promoters were used to modify IGF1 expression. Hammerheads: decreased lifespans. Arrows: increased lifespans. References: Gong [10]; Li [8]; Ashp [9]. (B) IGF1R++ and IGF1R+- mice were compared. Hammerheads: females. Arrows: males. References: Holz [12]; Bok [11]; Xu [34].
Figure 5 — In mice transgenic for IGF1 under keratin-14 promoter, lifespan is decreased and the rates of aging and thymus involution are accelerated | Aging