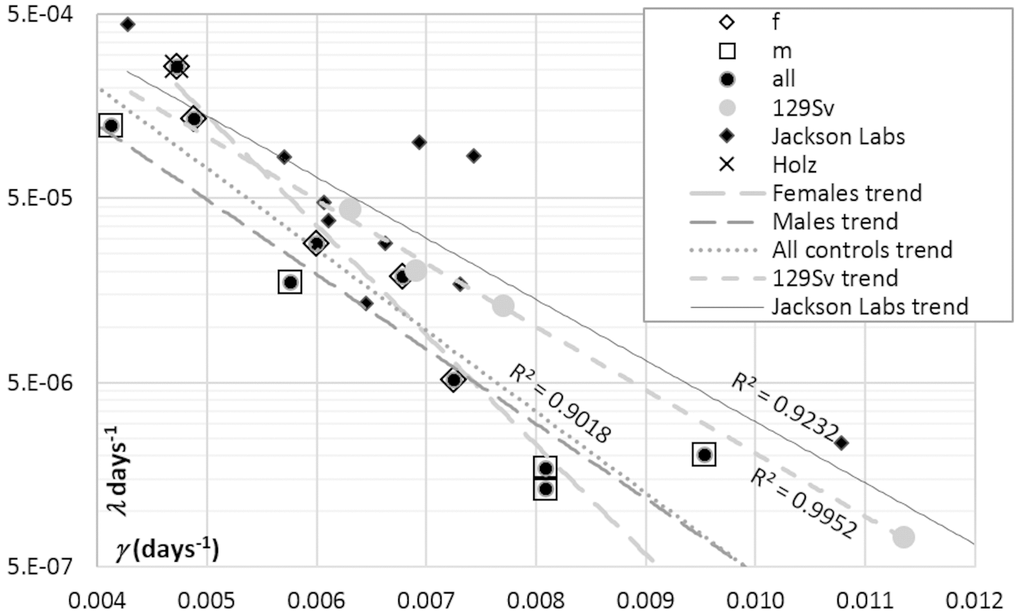
Figure 4.Correlations between GM parameters (μ0 and γ) derived from the survival curves of: (i) control mice used in IGF1 signaling experiments performed in different labs (see references to Figure 5), (ii) female mice bread at Jackson Laboratories, and (iii) several samples of female 129/Sv mice bread at authors’ laboratory [20]. The cross (Holz) in the upper left corner highlights the point related to female 129/Sv mice studied by Holzenberger et al. [12] and confirms the general consistency of the female 129/Sv trend, which is shown with gray round markers.