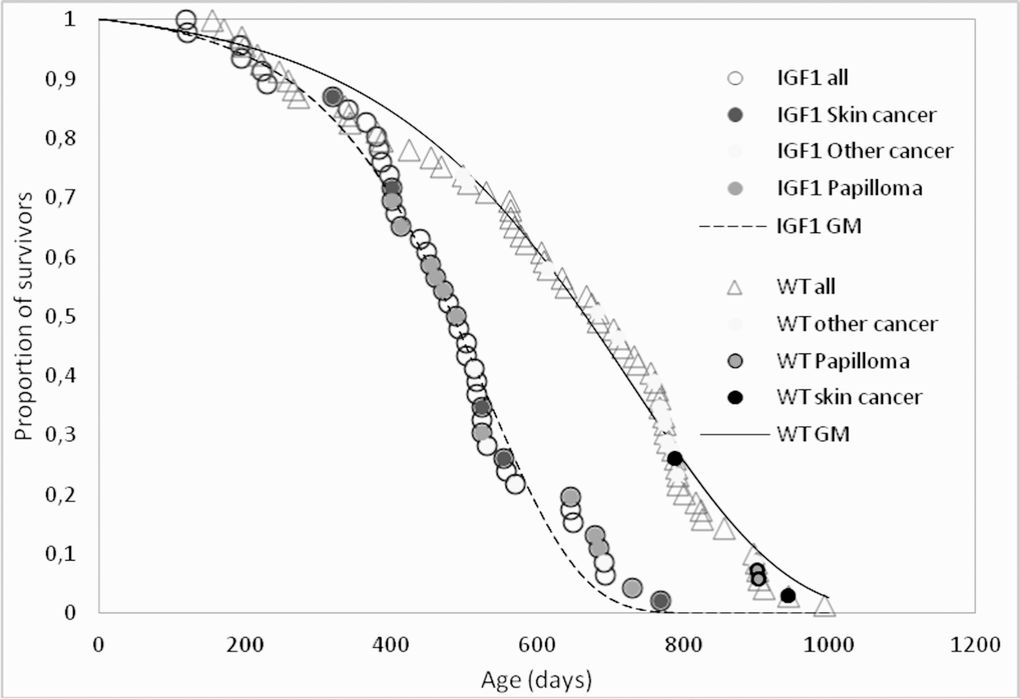
Figure 2.Survival patterns of K14/IGF1 mice (IGF1, dashed line) and WT FVB mice (solid line). Data points associated with postmortem tumor detection are shade-coded. Smooth lines show survival data approximations with the Gomperz model (GM).
Figure 2 — In mice transgenic for IGF1 under keratin-14 promoter, lifespan is decreased and the rates of aging and thymus involution are accelerated | Aging