Submit an Article
Navigate
Home
Editorial Board
Editorial Policies
Current Volume
Archive
Scientific Integrity
Publication Ethics Statements
Interviews with Outstanding Authors
Newsroom
Sponsored Conferences
Podcast
Contact
Special Collections
Submit an Article
Online ISSN: 1945-4589
Research Paper
|
Volume 11, Issue 6
|
pp. 1874–1899
DNA methylation in genes of longevity-regulating pathways: association with obesity and metabolic complications
Back to article
Figure 7
(7 of 7)
−
100%
+
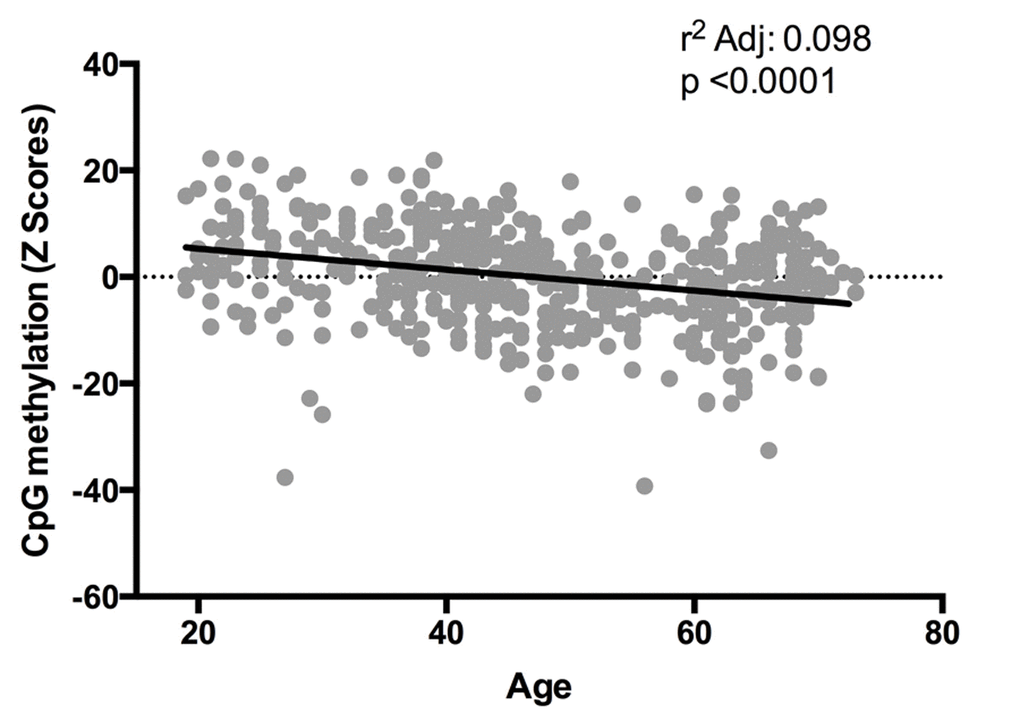
Figure 7.
Relation between Z-scores of methylation levels and age. Values reflect the significant change in Z-scores from CpG methylation (25 CpG sites, n=474) according age, after BMI adjustment.