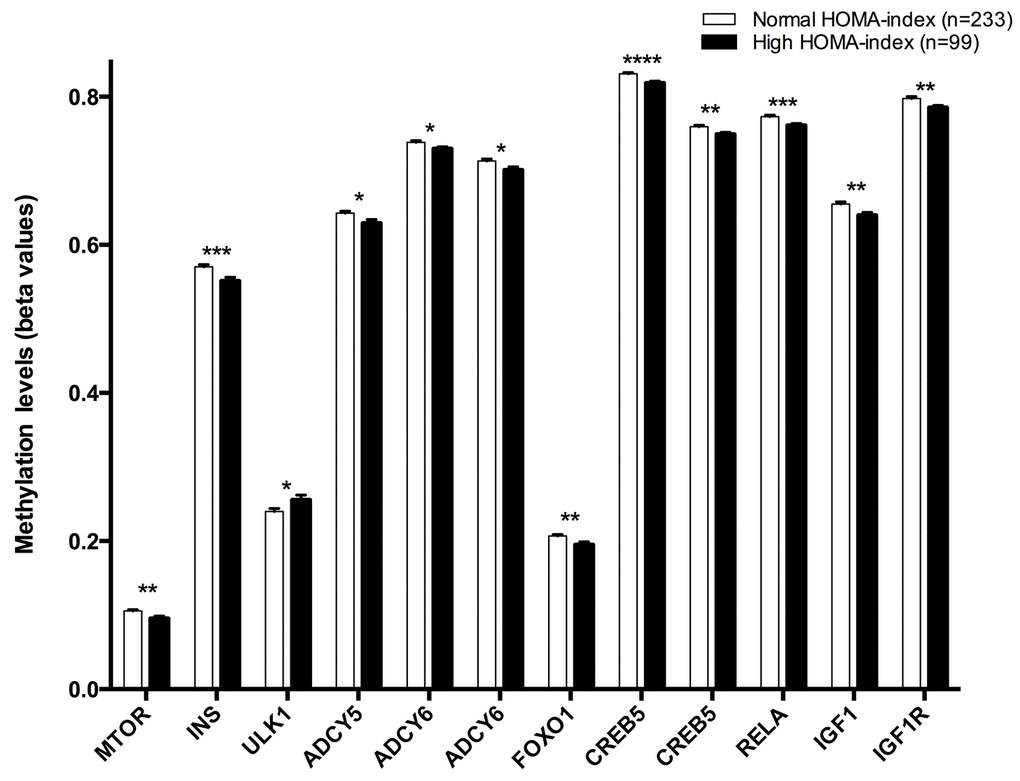
Figure 3.Methylation levels (beta values mean ± SEM) of CPGs located at genes of the longevity-regulating pathway in relation to HOMA-index categories after age and sex adjustments. Normal HOMA-index vs High HOMA-index levels, p<0.05*; p<0.01**; p<0.001***; p<0.0001****. Cut-off value between both groups was a 2.4 HOMA-IR index, higher levels was considered insulin resistant.