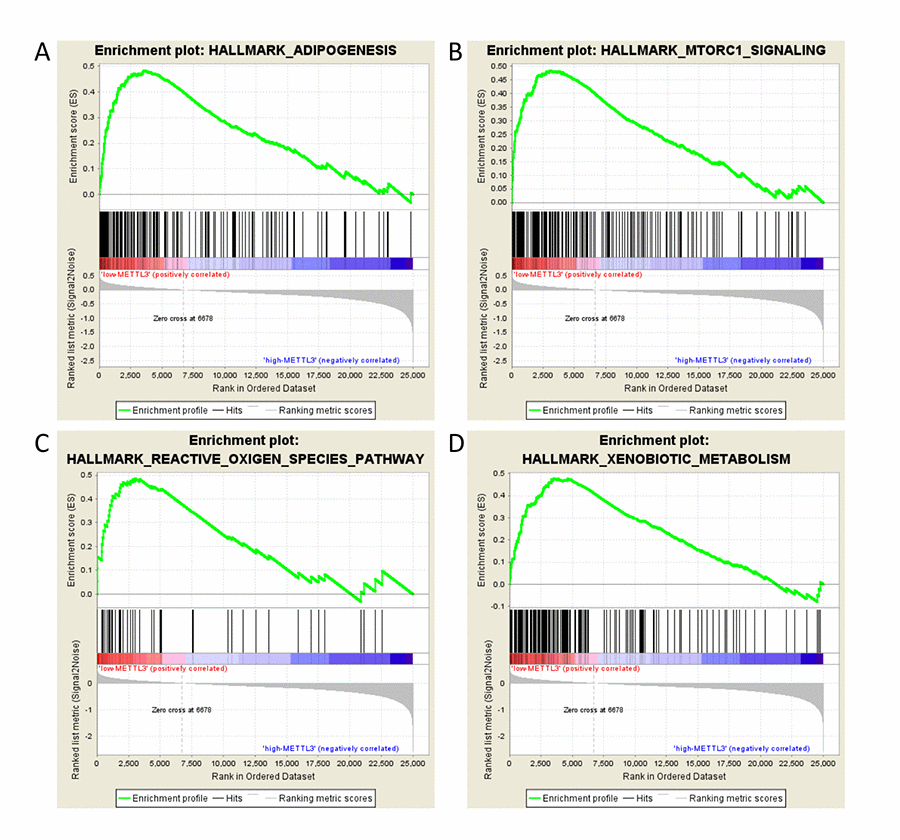
Figure 5.GSEA results of different expression level of METTL3. Gene set enrichment plots of (A) adipogenesis, (B) mTORC1 signaling, (C) reactive oxygen species, and (D) xenobiotic metabolism pathways related to low METTL3 mRNA level in the ccRCC samples.