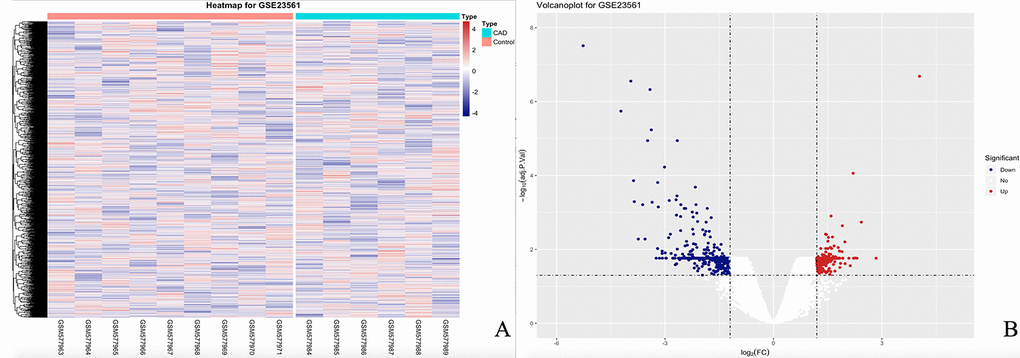
Figure 1.The heatmap and volcanoplot for DEGs. (A) For the heatmap, the control samples are shown as a red cluster, and the CAD samples are shown as a green cluster. (B) For the volcano plot, the two vertical lines show the 1.2-fold change boundaries and the horizontal line the statistical significance boundary (adj-P < 0.05). Items with statistical significance and upregulation are marked with red dots, and downregulated with blue dots in the volcano plot.