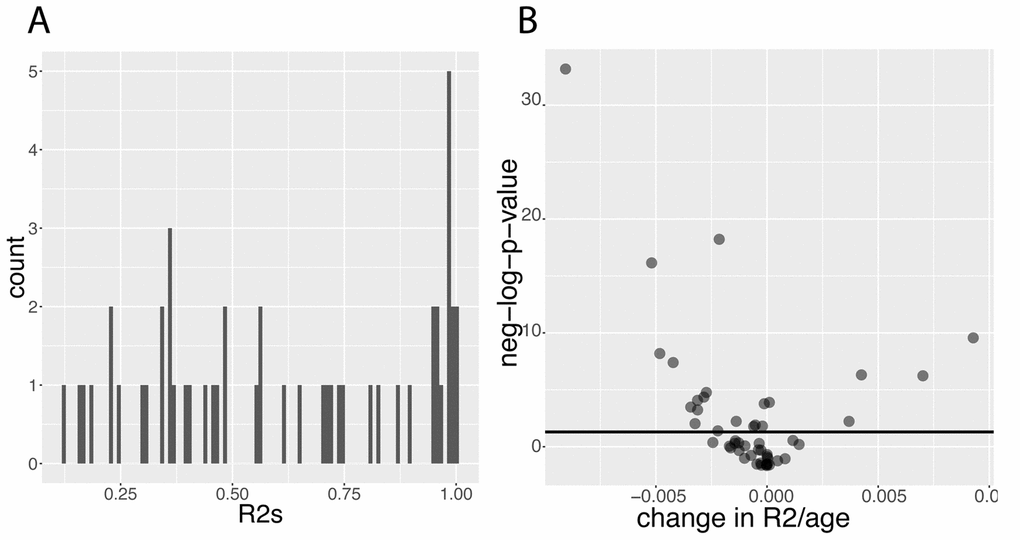
Figure 9.Predictabilities: Baseline predictabilities for the 50 biomarkers and significance of their changes with age. (A) Histogram of the predictabilities.Histogram of the predictabilities (R2) obtained on the 50 biomarkers using the full 27,508 samples. (B) Volcano plot of the changes in predictabilities with age.The horizontal black lines represent the threshold of significance of 0.05 for the Bonferroni corrected p-values.