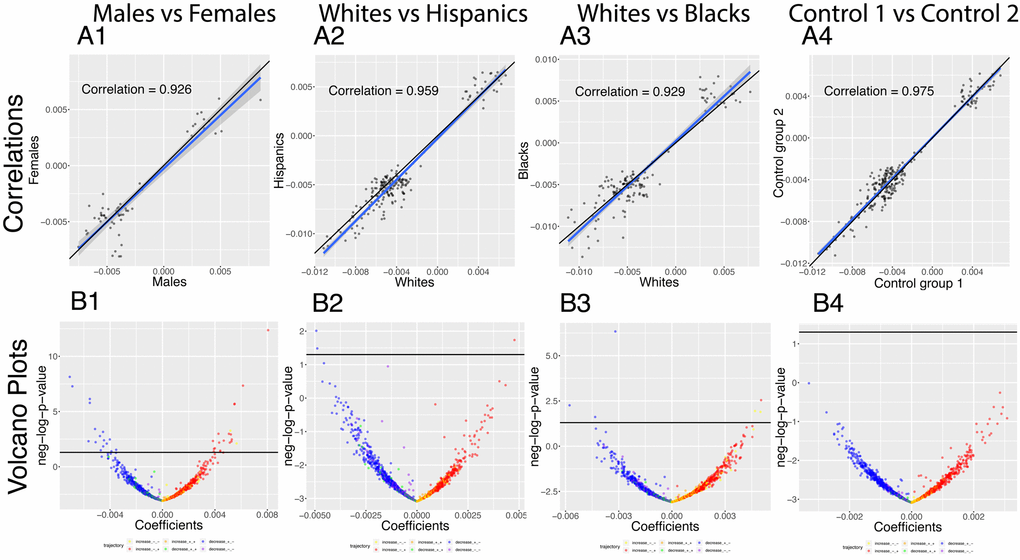
Figure 8.Correlations: Differences in age trajectories between demographics. (A) Correlations between the rates at which the correlations are changing in the two compared groups, only taking into account the correlations for which significant changes were detected in both compared groups (e.g. males and females). (B) Volcano plots showing differences in the rates of change of correlations with age between different demographic groups. The horizontal black lines represent the threshold of significance of 0.05 for the Bonferroni corrected p-values.