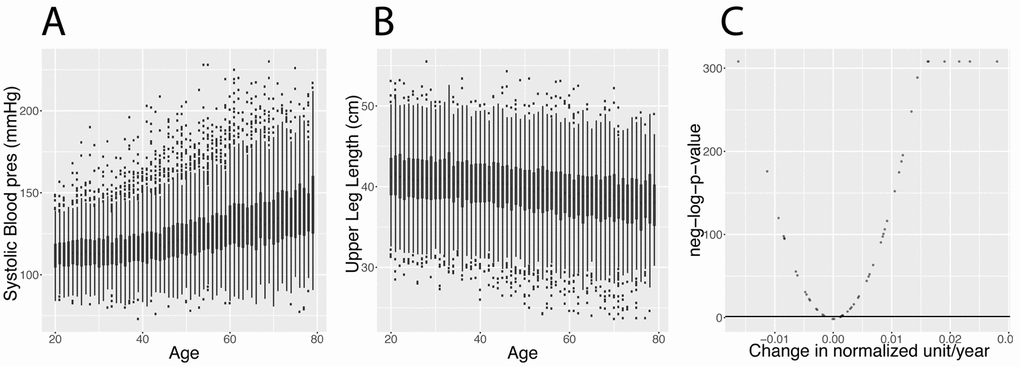
Figure 2.Changes in biomarkers with age. (A) Systolic blood pressure. Example of a biomarker that increases with age. (B) Upper leg length. Example of a biomarker that significantly decreases with age. (See discussion for explanation about the generational effect). (C) Volcano plot of the significance of the changes associated with age for the 50 biomarkers. The black horizontal line corresponds to the 0.05 significant threshold, after Bonferroni correction.