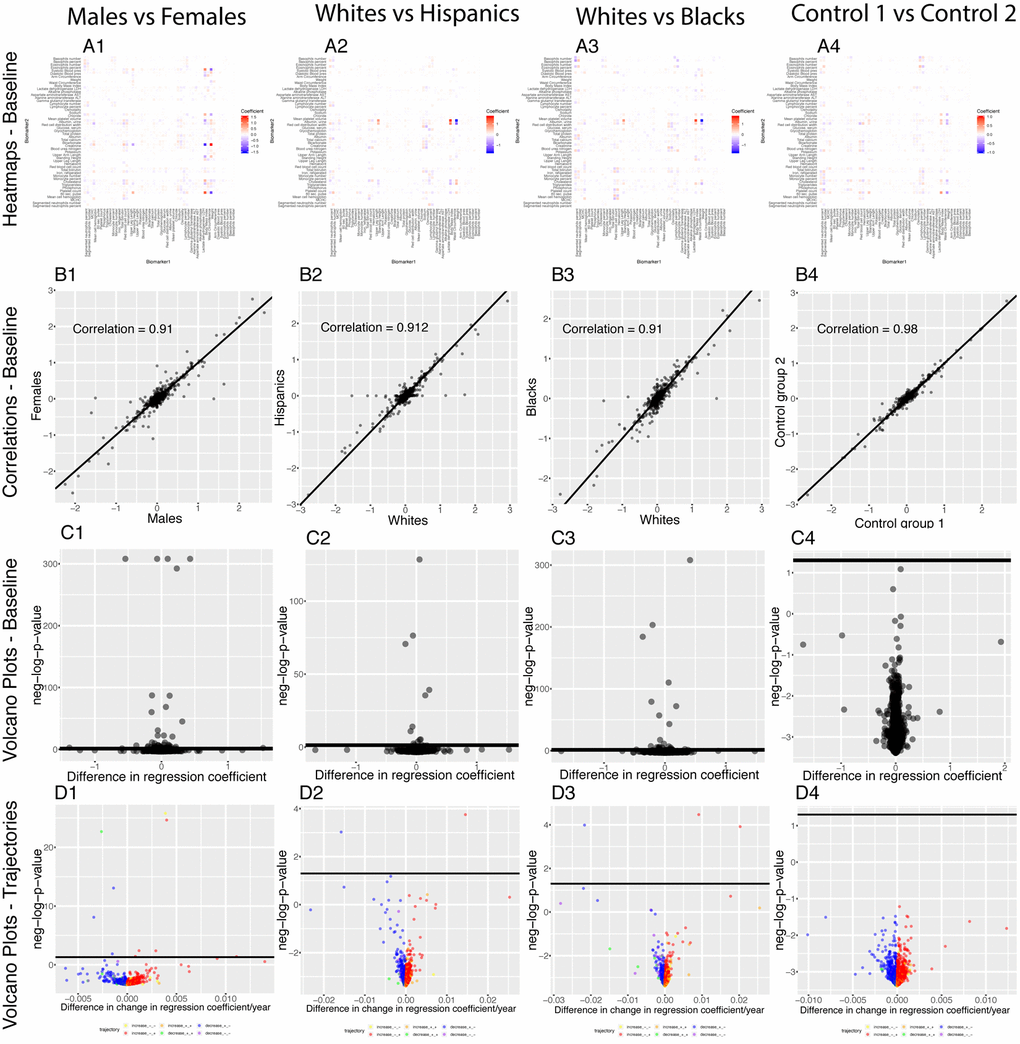
Figure 14.Regression coefficients: Differences between demographics. (A) Heatmaps displaying the baseline differences in the regression coefficients between demographic groups. (B) Correlation between the 2,450 regression coefficients in the first group and the 2,450 regression coefficients in the second group. The diagonal black line represents a perfect correlation. The further away from this line the points lie, the bigger the difference between the two groups is, and the lower the correlation coefficient is. (C) Volcano plots reporting the baseline (calculated on the full age range 20-80) differences in regression coefficients between the groups. The horizontal black lines represent the threshold of significance of 0.05 for the Bonferroni corrected p-values. (D) Volcano plots showing which regression coefficients are changing at significantly different rates with age in different demographic groups. The horizontal black lines represent the threshold of significance of 0.05 for the Bonferroni corrected p-values.