Submit an Article
Navigate
Home
Editorial Board
Editorial Policies
Current Volume
Archive
Scientific Integrity
Publication Ethics Statements
Interviews with Outstanding Authors
Newsroom
Sponsored Conferences
Podcast
Contact
Special Collections
Submit an Article
Online ISSN: 1945-4589
Research Paper
|
Volume 11, Issue 5
|
pp. 1404–1426
Age-dependent co-dependency structure of biomarkers in the general population of the United States
Back to article
Figure 1
(1 of 14)
−
100%
+
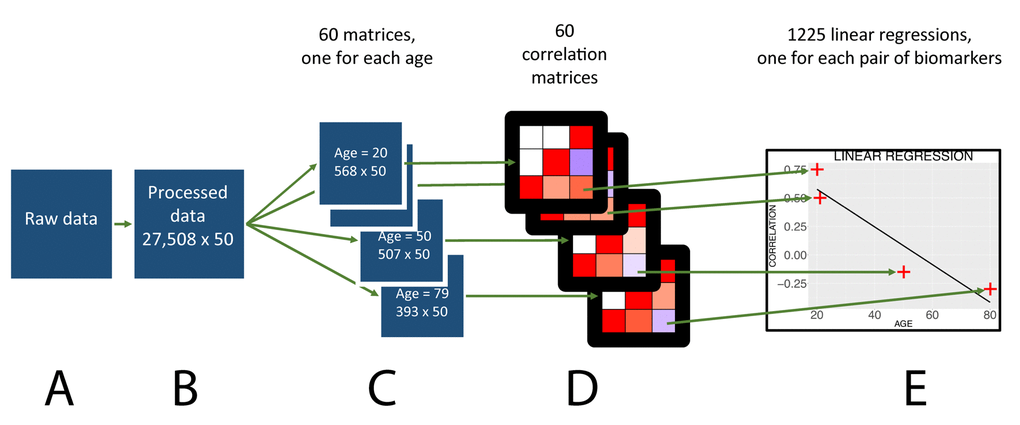
Figure 1.
Flowchart to analyze the age trajectories of the correlations.
Figure 1 — Age-dependent co-dependency structure of biomarkers in the general population of the United States | Aging